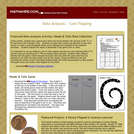
Using two different coins and recording the results of both coins helps …
Using two different coins and recording the results of both coins helps students dispel this initial misconception as they analyze the graph results. Class discussion should focus on analyzing the data to determine if the game is fair or not. Directions and gameboard are included in the download.
This course is for all of those struggling with data analysis. That …
This course is for all of those struggling with data analysis. That crazy data collection from your boss? Megabytes of sensor data to analyze? Looking for a smart way visualize your data in order to make sense out of it? We’ve got you covered!
Using video lectures and hands-on exercises, we will teach you cutting-edge techniques and best practices that will boost your data analysis and visualization skills.
This course has been awarded with the Wharton-QS gold education award in the category Regional awards Europe. We will take a deep dive into data analysis with spreadsheets: PivotTables, VLOOKUPS, Named ranges, what-if analyses, making great graphs – all those will be covered in the first weeks of the course. After that, we will investigate the quality of the spreadsheet model, and especially how to make sure your spreadsheet remains error-free and robust.
Finally, once we have mastered spreadsheets, we will demonstrate other ways to store and analyze data. We will also look into how Python, a programming language, can help us with analyzing and manipulating data in spreadsheets.
This course is created using Excel 2013 and Windows. Most assignments can be made using another spreadsheet program and operating system as well, but we cannot offer full support for all configurations.
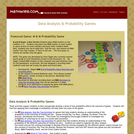
These activities support students as they conceptually develop a sense of how …
These activities support students as they conceptually develop a sense of how probability affects the outcome of games. Students will find that applying their knowledge of probability will help them win some of the games
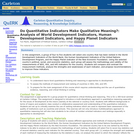
The A2DataDive assembled representatives from nonprofit organizations, U-M statistics and data sciences …
The A2DataDive assembled representatives from nonprofit organizations, U-M statistics and data sciences departments, and members of the community to collectively address the data analysis and visualization needs for area nonprofits and local organizations. Open.Michigan was one of the organizers of the A2DataDive, and worked with two School of Information graduate students to scope and implement the event. After identifying two organizations who had data needs:ŰÖFocus HopeŰÖand theŰÖAfrican Health OER Network, this joint community/university datadive took place over a weekend in February 2012 in North Quads space 2435, an adaptable space especially suited to collaborative, participatory work. The A2DataDive was a successful proof-of-concept for a joint collaboration between an academic institution and local organizations and businesses, and demonstrated that sharing skills and expertise to address a need is also a great way to help others.
Learn how instructional designers use data to inform the creation of a …
Learn how instructional designers use data to inform the creation of a Learning Persona. Learning Personas help determine the needs of the training and help ...
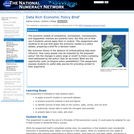
This assignment asks students to write a data-rich policy brief, showing their …
This assignment asks students to write a data-rich policy brief, showing their ability to apply standard microeconomic models and contextualizing the policy debate with numeric evidence.
This course explores visualization methodologies to conceive and represent systems and data, …
This course explores visualization methodologies to conceive and represent systems and data, e.g., financial, media, economic, political, etc., with a particular focus on climate change data in this version of the course. Topics include basic methods for research, cleaning, and analysis of datasets, and creative methods of data presentation and storytelling. The course considers the emotional, aesthetic, ethical, and practical effects of different presentation methods as well as how to develop metrics for assessing impact. Coursework includes readings, visualization exercises, and a final project.
In this assignment, a group of four to five students will select …
In this assignment, a group of four to five students will select one country that has been ranked in the World Development Indicators of the World Bank, the Human Development Indicators of the United Nations Development Program, and the Happy Planet Indicator of the New Economic Foundation. Using the selected country's political, social, and economic statistics, each group will assess the methodology and validity of the measurements of WDI, HDI, and HPI indicators for the country. Students will compare and contrast the measurement methods, analyze the strengths and weaknesses of each indicator, and propose recommendations to improve these indicators.
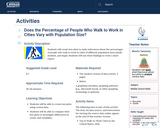
Students will create box plots to make inferences about the percentages of …
Students will create box plots to make inferences about the percentages of people who walk to work in cities of different population sizes (small, medium, and large). Students will use these findings to write a short report.
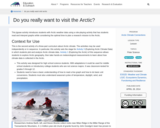
This jigsaw activity introduces students with Arctic weather data using a role-playing …
This jigsaw activity introduces students with Arctic weather data using a role-playing activity that has students read and interpret graphs while considering the optimal time to plan a research mission to the Arctic.
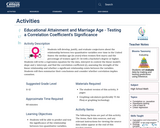
Students will develop, justify, and evaluate conjectures about the relationship between two …
Students will develop, justify, and evaluate conjectures about the relationship between two quantitative variables over time in the United States: the median age (in years) when women first marry and the percentage of women aged 25–34 with a bachelor’s degree or higher. Students will write a regression equation for the data, interpret in context the linear model’s slope and y-intercept, and find the correlation coefficient (r), assessing the strength of the linear relationship and whether a significant relationship exists between the variables. Students will then summarize their conclusions and consider whether correlation implies causation.
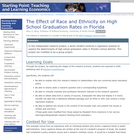
In this individual research project, a senior thesis student conducts a regression …
In this individual research project, a senior thesis student conducts a regression analysis that investigates the effects of race, ethnicity, and poverty on high school graduation rates in Florida. The data are easily obtainable from the Florida Department of Education. The project can be modified to be a group research project in a Research Methods Class or a Special Topics Upper Level Economics class.
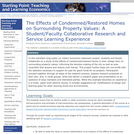
In this undergraduate research and service learning project, students and faculty collaborate …
In this undergraduate research and service learning project, students and faculty collaborate on a study of the effects of condemned/restored homes in their college town on surrounding property values. While this example describes an experience in a small, upper-level elective course, it includes suggestions for modifications of design and learning goals for other learning levels and environments.
This assignment teaches students how to evaluate arguments concerning the maldistribution of …
This assignment teaches students how to evaluate arguments concerning the maldistribution of environmental hazards, based on complex quantitative data.
This curriculum, which can be used in whole or in part, provides …
This curriculum, which can be used in whole or in part, provides background legislative initiatives, evaluations of Family Preservation/Support Programs in different areas of the country, and techniques in evaluating community-based programs. Chapters include: a description of the development of Family Preservation/Family Support programs including key federal legislation and California's implementation process; a review of current literature on both family support and family preservation evaluations; a state-wide matrix of County Five-Year Plans for the Family Preservation/Support Program Initiative, summaries of 10 county Five-Year Plans, and case studies of three counties; information on single-subject designs including the nature and scope of single-subject research and its relationship to time-series design; information on collecting and analyzing administrative level data to determine whether change has occurred in a target community; and analysis of administrative level data within a single-system design framework. This module addresses Child Welfare Policy, Planning and Administration competencies. (343 pages)Rogers, K., Ferguson, C., Barth, R. P., & Embry, R. (1998).
Mathematical literacy textbook for grade 10. This resource includes an interactive online …
Mathematical literacy textbook for grade 10. This resource includes an interactive online textbook that can be read on personal computers, tablets, and mobile phones. Downloadable textbook and and teachers' guide also available in PDF format, in both English and Afrikaans
No restrictions on your remixing, redistributing, or making derivative works. Give credit to the author, as required.
Your remixing, redistributing, or making derivatives works comes with some restrictions, including how it is shared.
Your redistributing comes with some restrictions. Do not remix or make derivative works.
Most restrictive license type. Prohibits most uses, sharing, and any changes.
Copyrighted materials, available under Fair Use and the TEACH Act for US-based educators, or other custom arrangements. Go to the resource provider to see their individual restrictions.