Students will examine and interpret a population chart published in 1898 — …
Students will examine and interpret a population chart published in 1898 — depicting changes in the makeup of the United States across time in three categories, “foreign stock,” “native stock,” and “colored” — as well as an 1893 political cartoon about immigration. Students will also explain the causes and effects of population change in the late 19th century.
This online course is designed to help anyone teach – and learn …
This online course is designed to help anyone teach – and learn – with a 21st century approach to knowledge and teaching. Lesson 1 of the course shares important evidence we now have about the working of the brain, that is meaningful for all subjects and ages – and lives. We then move to thinking together about the data filled world in which we live, to prepare students for their future in a world of data. The aim of a data science approach is not to add new standards or content to your teaching, it is about interacting with your content in a data science way – that is fun, interesting and creative. In the course you will experience lessons that you can take and use with your students, and you will see lots of classroom and lesson examples. Whether you are a kindergarten teacher, a high school history or maths teacher, an administrator or parent, or someone just curious about data science, there will be ideas for you.
Using cameras mounted to drones, students will design and construct an experiment …
Using cameras mounted to drones, students will design and construct an experiment to take enough photos to make a 3-dimensional image of an outcrop or landform in a process called structure from motion (SfM). This activity has both a hands-on component (collecting data with the drone) and a computer-based component (creating the 3-dimensional model).___________________Drones can take photos that can be analyzed later. By planning ahead to have enough overlap between photos, you take those individual photos and make a 3-dimensional image!In this activity, you guide the students to identify an outcrop or landform to study later or over repeat visits. They go through the process to plan, conduct, and analyze an investigation to help answer their science question.The Challenge: Design and conduct an experiment to take enough photos to make a 3-dimensional image of an outcrop or landform, then analyze the image and interpret the resulting 3-d image.For instance they might wish to study a hillside that has been changed from a previous forest fire. How is the hillside starting to shift after rainstorms or snows? Monitoring an area over many months can lead to discoveries about how the erosional processes happen and also provide homeowners, park rangers, planners, and others valuable information to take action to stabilize areas to prevent landslides.
(Note: this resource was added to OER Commons as part of a batch upload of over 2,200 records. If you notice an issue with the quality of the metadata, please let us know by using the 'report' button and we will flag it for consideration.)
This is a task from the Illustrative Mathematics website that is one …
This is a task from the Illustrative Mathematics website that is one part of a complete illustration of the standard to which it is aligned. Each task has at least one solution and some commentary that addresses important aspects of the task and its potential use.
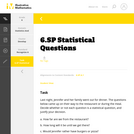
The students will use ACC basketball statistics to practice the process of …
The students will use ACC basketball statistics to practice the process of converting fractions to decimals then to percents and will learn how to create and edit a spreadsheet. They will then use this spreadsheet to analyze their data. This unit is done during the basketball season which takes approximately 15 weeks from the middle of November to the middle of March. Teachers must have Clarisworks to open the sample spreadsheet in the lesson, but may recreate it in another spreadsheet program.
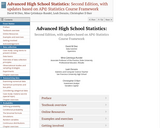
Description: This is the online, interactive version of OpenIntro's Advanced High School …
Description:
This is the online, interactive version of OpenIntro's Advanced High School Statistics (https://www.openintro.org/book/ahss/). It was developed by Emiliano Vega and Ralf Youtz of Portland Community College using PreTeXt.
We hope readers will take away three ideas from this book in addition to forming a foundation of statistical thinking and methods:
1. Statistics is an applied field with a wide range of practical applications.
2. You don't have to be a math guru to learn from real, interesting data.
3. Data are messy, and statistical tools are imperfect. But, when you understand the strengths and weaknesses of these tools, you can use them to learn about the real world.
Learn the fundamentals of machine learning to help you correctly apply various …
Learn the fundamentals of machine learning to help you correctly apply various classification and regression machine learning algorithms to real-life problems.
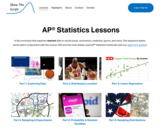
A full AP® Statistics curriculum that explores relevant data in social issues, …
A full AP® Statistics curriculum that explores relevant data in social issues, economics, medicine, sports, and more. The sequence works well in conjunction with the course CED and the most widely-used AP® Statistics textbooks.
This is a computer-based activity in which students retrieve data from websites …
This is a computer-based activity in which students retrieve data from websites maintained by the US Geological Survey (USGS) and the National Weather Service (NWS), and then use that data to test different hypotheses regarding streamflow and precipitation. Students import data from web sites into a spreadsheet program where they can construct scatter plots and perform simple statistical tests. The activity has two components, the first focusing on relations between streamflow and drainage basin characteristics (drainage area, slope, precipitation), the second focusing on trends in annual precipitation at two locations in the USA: Burlington, VT, and Boulder, CO. As part of the second component, students conduct a statistical test to determine if the long-term trends in precipitation are significant.
(Note: this resource was added to OER Commons as part of a batch upload of over 2,200 records. If you notice an issue with the quality of the metadata, please let us know by using the 'report' button and we will flag it for consideration.)
This resource can be used in providing real-life activity for students by conducting …
This resource can be used in providing real-life activity for students by conducting survey. Results of their survey will be organized and presented through text, graphs and tables with research ethics observed.
Adapted from OpenStax by Darlene Young Short Description: Introductory Statistics follows scope …
Adapted from OpenStax by Darlene Young
Short Description: Introductory Statistics follows scope and sequence requirements of a one-semester introduction to statistics course and is geared toward students majoring in fields other than math or engineering. The text assumes some knowledge of intermediate algebra and focuses on statistics application over theory. Introductory Statistics includes innovative practical applications that make the text relevant and accessible, as well as collaborative exercises, technology integration problems, and statistics labs.
Long Description: Senior Contributing Authors Barbara Illowsky, De Anza College Susan Dean, De Anza College
Word Count: 227030
(Note: This resource's metadata has been created automatically as part of a bulk import process by reformatting and/or combining the information that the author initially provided. As a result, there may be errors in formatting.)
This is a task from the Illustrative Mathematics website that is one …
This is a task from the Illustrative Mathematics website that is one part of a complete illustration of the standard to which it is aligned. Each task has at least one solution and some commentary that addresses important aspects of the task and its potential use.
Students will use the Census Business Builder: Small Business Edition data access …
Students will use the Census Business Builder: Small Business Edition data access tool to gather and analyze information that entrepreneurs may consider when opening a business. This introductory activity assumes that students have limited experience using data access tools.
No restrictions on your remixing, redistributing, or making derivative works. Give credit to the author, as required.
Your remixing, redistributing, or making derivatives works comes with some restrictions, including how it is shared.
Your redistributing comes with some restrictions. Do not remix or make derivative works.
Most restrictive license type. Prohibits most uses, sharing, and any changes.
Copyrighted materials, available under Fair Use and the TEACH Act for US-based educators, or other custom arrangements. Go to the resource provider to see their individual restrictions.