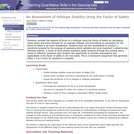
In this problem set students are given Rb/Sr and 87Sr/86Sr data for …
In this problem set students are given Rb/Sr and 87Sr/86Sr data for whole rock and mineral samples from three granitic intrusions in the Sierra Nevada. They use these data (in EXCEL) to calculate isochron ages and initial ages for the intrusions and then interpret their results. This problem is intended to teach some spreadsheet skills (linear regressions, graphing) as well as having them think about the use of radiogenic isotopes.
(Note: this resource was added to OER Commons as part of a batch upload of over 2,200 records. If you notice an issue with the quality of the metadata, please let us know by using the 'report' button and we will flag it for consideration.)
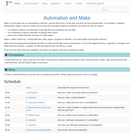
Does the real-world application of science depend on mathematics? In this activity, …
Does the real-world application of science depend on mathematics? In this activity, students answer this question as they experience a real-world application of systems of equations. Given a system of linear equations that mathematically models a specific circuit—students start by solving a system of three equations for the currents. After becoming familiar with the parts of a breadboard, groups use a breadboard, resistors and jumper wires to each build the same (physical) electric circuit from the provided circuit diagram. Then they use voltmeters to measure the current flow across each resistor and calculate the current using Ohm’s law. They compare the mathematically derived current values to the measured values, and calculate the percentage difference of their results. This leads students to conclude that real-world applications of science do indeed depend on mathematics! Students make posters to communicate their results and conclusions. A pre/post-activity quiz and student worksheet are provided. Adjustable for math- or science-focused classrooms.
This lab exercise provides students with activities utilizing vector operations within the …
This lab exercise provides students with activities utilizing vector operations within the context of the atmospheric and oceanic environments.
(Note: this resource was added to OER Commons as part of a batch upload of over 2,200 records. If you notice an issue with the quality of the metadata, please let us know by using the 'report' button and we will flag it for consideration.)
Applied Mathematics, Third Edition. This textbook was written for the math component …
Applied Mathematics, Third Edition. This textbook was written for the math component for Associate of Applied Science degrees at the College of Southern Nevada.
NSCC MATH 1020 Short Description: Applied Math for Food Service is an …
NSCC MATH 1020
Short Description: Applied Math for Food Service is an adapted open textbook created by Amy Savoury. This new open textbook remixes content from two open textbooks published by BC Campus under CC BY licences: Basic Kitchen & Food Service Management by The BC Cook Articulation Committee, and Math for Trades by Chad Flinn and Mark Overgaard.
Word Count: 26676
ISBN: 978-1-990641-68-8
(Note: This resource's metadata has been created automatically by reformatting and/or combining the information that the author initially provided as part of a bulk import process.)
Student teams investigate Arctic Sea Ice by analyzing actual data and making …
Student teams investigate Arctic Sea Ice by analyzing actual data and making predictions. A worthwhile extension is to predict the first year that the Arctic Ocean will be ice free.
(Note: this resource was added to OER Commons as part of a batch upload of over 2,200 records. If you notice an issue with the quality of the metadata, please let us know by using the 'report' button and we will flag it for consideration.)
This unit explores the various ways information and ideas about climate change …
This unit explores the various ways information and ideas about climate change are presented through a variety of media. This includes the evaluation of social media posts, research into climate change issues, and an exploration of contemporary art and artists. This was designed and taught in an honors 9th grade English Language Arts Classroom by Dr. Tavia Quaid in response to student interest in climate change and to reinforce key information literacy skills.
This unit explores the various ways information and ideas about climate change …
This unit explores the various ways information and ideas about climate change are presented through a variety of media. This includes the evaluation of social media posts, research into climate change issues, and an exploration of contemporary art and artists.
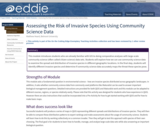
This module introduces students who are already familiar with GIS to doing …
This module introduces students who are already familiar with GIS to doing comparative analyses with large-scale community science (often called citizen science) data sets. Students will explore how we can use community science data to examine the spread and distribution of invasive species in different geographic locations. In the final step, students will identify different invasive species and determine if community science data accurately maps the threat these species pose.
(Note: this resource was added to OER Commons as part of a batch upload of over 2,200 records. If you notice an issue with the quality of the metadata, please let us know by using the 'report' button and we will flag it for consideration.)
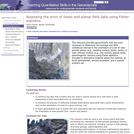
Instruction on use of Fisher statistics to determine the mean and 95% …
Instruction on use of Fisher statistics to determine the mean and 95% confidence interval of geological vectors, lines or planes, with examples, problems and an Excel spreadsheet for computation.
(Note: this resource was added to OER Commons as part of a batch upload of over 2,200 records. If you notice an issue with the quality of the metadata, please let us know by using the 'report' button and we will flag it for consideration.)
In this homework assignment students are asked to consider the balance of …
In this homework assignment students are asked to consider the balance of forces on a hill slope using the Factor of Safety.
(Note: this resource was added to OER Commons as part of a batch upload of over 2,200 records. If you notice an issue with the quality of the metadata, please let us know by using the 'report' button and we will flag it for consideration.)
A Software Carpentry lesson to learn how to use Make Make is …
A Software Carpentry lesson to learn how to use Make Make is a tool which can run commands to read files, process these files in some way, and write out the processed files. For example, in software development, Make is used to compile source code into executable programs or libraries, but Make can also be used to: run analysis scripts on raw data files to get data files that summarize the raw data; run visualization scripts on data files to produce plots; and to parse and combine text files and plots to create papers. Make is called a build tool - it builds data files, plots, papers, programs or libraries. It can also update existing files if desired. Make tracks the dependencies between the files it creates and the files used to create these. If one of the original files (e.g. a data file) is changed, then Make knows to recreate, or update, the files that depend upon this file (e.g. a plot). There are now many build tools available, all of which are based on the same concepts as Make.
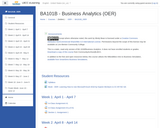
Second course in a two-course sequence. Introduces and applies technical skills around …
Second course in a two-course sequence. Introduces and applies technical skills around beginning and managing a small business, including spreadsheets and the use of charts and graphs. Includes reflection and discussion of the application of concepts to a real-world example. Requires teamwork and collaboration to be exercised in completing a group project. Covers application of financial, legal, and administrative procedures in running a business. Upon successful completion of this course, students will be able to: Represent business models in spreadsheets including preparation of charts and graphs. Apply key business activities and the primary concepts and terms associated with these activities. Manage a business interacting with the external environment (through a simulation) and describe how this interaction impacts both business and the external environment. Implement the financial, legal, and administrative procedures involved in starting new business ventures. Identify ethical issues facing businesses. Effectively collaborate with team members and communicate professionally.
Modeling traffic data is important for urban planning, creating transportation systems, and …
Modeling traffic data is important for urban planning, creating transportation systems, and even predicting how much foot traffic a retail store can expect in a given day. This genre of dynamic data science activities could be classified as “finding a needle in a haystack,” giving students a chance to mine big data to make insights about traffic use.
According to the Bay Area Rapid Transit District, about 400,000 people used the BART system daily in 2018. In BARTy, students investigate BART data from 2015 to learn about passenger use and explore traffic patterns. The Teacher Guide includes a game-like investigation to locate a “mystery meeting,” and suggests ways to help students figure out peak passenger use, popular stations, and the impact of events in San Francisco on BART usage.
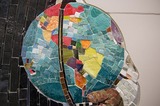
Baby Proportions is an activity designed to challenge students to compare body …
Baby Proportions is an activity designed to challenge students to compare body measurement proportions of adults, students and infants. They then use these proportions to create a scale drawing of themselves and an infant enlarged to be their same height. The idea is to use real world measurements in practicing proportional relationship skills while creating an interesting image when finished.
No restrictions on your remixing, redistributing, or making derivative works. Give credit to the author, as required.
Your remixing, redistributing, or making derivatives works comes with some restrictions, including how it is shared.
Your redistributing comes with some restrictions. Do not remix or make derivative works.
Most restrictive license type. Prohibits most uses, sharing, and any changes.
Copyrighted materials, available under Fair Use and the TEACH Act for US-based educators, or other custom arrangements. Go to the resource provider to see their individual restrictions.