Python es un lenguaje de programación general que es útil para escribir …
Python es un lenguaje de programación general que es útil para escribir scripts para trabajar con datos de manera efectiva y reproducible. Esta es una introducción a Python diseñada para participantes sin experiencia en programación. Estas lecciones pueden enseñarse en un día (~ 6 horas). Las lecciones empiezan con información básica sobre la sintaxis de Python, la interface de Jupyter Notebook, y continúan con cómo importar archivos CSV, usando el paquete Pandas para trabajar con DataFrames, cómo calcular la información resumen de un DataFrame, y una breve introducción en cómo crear visualizaciones. La última lección demuestra cómo trabajar con bases de datos directamente desde Python. Nota: los datos no han sido traducidos de la versión original en inglés, por lo que los nombres de variables se mantienen en inglés y los números de cada observación usan la sintaxis de habla inglesa (coma separador de miles y punto separador de decimales).
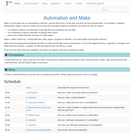
A Software Carpentry lesson to learn how to use Make Make is …
A Software Carpentry lesson to learn how to use Make Make is a tool which can run commands to read files, process these files in some way, and write out the processed files. For example, in software development, Make is used to compile source code into executable programs or libraries, but Make can also be used to: run analysis scripts on raw data files to get data files that summarize the raw data; run visualization scripts on data files to produce plots; and to parse and combine text files and plots to create papers. Make is called a build tool - it builds data files, plots, papers, programs or libraries. It can also update existing files if desired. Make tracks the dependencies between the files it creates and the files used to create these. If one of the original files (e.g. a data file) is changed, then Make knows to recreate, or update, the files that depend upon this file (e.g. a plot). There are now many build tools available, all of which are based on the same concepts as Make.
Python is a general purpose programming language that is useful for writing …
Python is a general purpose programming language that is useful for writing scripts to work effectively and reproducibly with data. This is an introduction to Python designed for participants with no programming experience. These lessons can be taught in one and a half days (~ 10 hours). They start with some basic information about Python syntax, the Jupyter notebook interface, and move through how to import CSV files, using the pandas package to work with data frames, how to calculate summary information from a data frame, and a brief introduction to plotting. The last lesson demonstrates how to work with databases directly from Python.
Data Carpentry lesson from Ecology curriculum to learn how to analyse and …
Data Carpentry lesson from Ecology curriculum to learn how to analyse and visualise ecological data in R. Data Carpentry’s aim is to teach researchers basic concepts, skills, and tools for working with data so that they can get more done in less time, and with less pain. The lessons below were designed for those interested in working with ecology data in R. This is an introduction to R designed for participants with no programming experience. These lessons can be taught in a day (~ 6 hours). They start with some basic information about R syntax, the RStudio interface, and move through how to import CSV files, the structure of data frames, how to deal with factors, how to add/remove rows and columns, how to calculate summary statistics from a data frame, and a brief introduction to plotting. The last lesson demonstrates how to work with databases directly from R.
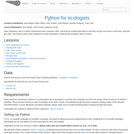
Python is a general purpose programming language that is useful for writing …
Python is a general purpose programming language that is useful for writing scripts to work effectively and reproducibly with data. This is an introduction to Python designed for participants with no programming experience. These lessons can be taught in a day (~ 6 hours). They start with some basic information about Python syntax, the Jupyter notebook interface, and move through how to import CSV files, using the pandas package to work with data frames, how to calculate summary information from a data frame, and a brief introduction to plotting. The last lesson demonstrates how to work with databases directly from Python.
Data Carpentry trains researchers in the core data skills for efficient, shareable, …
Data Carpentry trains researchers in the core data skills for efficient, shareable, and reproducible research practices. We run accessible, inclusive training workshops; teach openly available, high-quality, domain-tailored lessons; and foster an active, inclusive, diverse instructor community that promotes and models reproducible research as a community norm.
The Biology Semester-long Course was developed and piloted at the University of …
The Biology Semester-long Course was developed and piloted at the University of Florida in Fall 2015. Course materials include readings, lectures, exercises, and assignments that expand on the material presented at workshops focusing on SQL and R.
A part of the data workflow is preparing the data for analysis. …
A part of the data workflow is preparing the data for analysis. Some of this involves data cleaning, where errors in the data are identified and corrected or formatting made consistent. This step must be taken with the same care and attention to reproducibility as the analysis. OpenRefine (formerly Google Refine) is a powerful free and open source tool for working with messy data: cleaning it and transforming it from one format into another. This lesson will teach you to use OpenRefine to effectively clean and format data and automatically track any changes that you make. Many people comment that this tool saves them literally months of work trying to make these edits by hand.
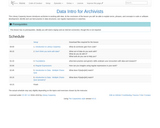
This Library Carpentry lesson introduces archivists to working with data. At the …
This Library Carpentry lesson introduces archivists to working with data. At the conclusion of the lesson you will: be able to explain terms, phrases, and concepts in code or software development; identify and use best practice in data structures; use regular expressions in searches.
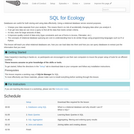
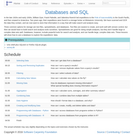
Databases are useful for both storing and using data effectively. Using a …
Databases are useful for both storing and using data effectively. Using a relational database serves several purposes. It keeps your data separate from your analysis. This means there’s no risk of accidentally changing data when you analyze it. If we get new data we can rerun a query to find all the data that meets certain criteria. It’s fast, even for large amounts of data. It improves quality control of data entry (type constraints and use of forms in Access, Filemaker, etc.) The concepts of relational database querying are core to understanding how to do similar things using programming languages such as R or Python. This lesson will teach you what relational databases are, how you can load data into them and how you can query databases to extract just the information that you need.
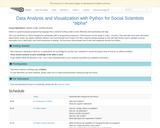
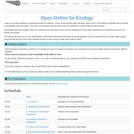
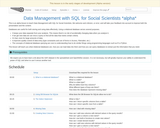
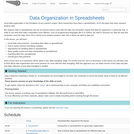
This is an alpha lesson to teach Data Management with SQL for …
This is an alpha lesson to teach Data Management with SQL for Social Scientists, We welcome and criticism, or error; and will take your feedback into account to improve both the presentation and the content. Databases are useful for both storing and using data effectively. Using a relational database serves several purposes. It keeps your data separate from your analysis. This means there’s no risk of accidentally changing data when you analyze it. If we get new data we can rerun a query to find all the data that meets certain criteria. It’s fast, even for large amounts of data. It improves quality control of data entry (type constraints and use of forms in Access, Filemaker, etc.) The concepts of relational database querying are core to understanding how to do similar things using programming languages such as R or Python. This lesson will teach you what relational databases are, how you can load data into them and how you can query databases to extract just the information that you need.
Good data organization is the foundation of any research project. Most researchers …
Good data organization is the foundation of any research project. Most researchers have data in spreadsheets, so it’s the place that many research projects start. We organize data in spreadsheets in the ways that we as humans want to work with the data, but computers require that data be organized in particular ways. In order to use tools that make computation more efficient, such as programming languages like R or Python, we need to structure our data the way that computers need the data. Since this is where most research projects start, this is where we want to start too! In this lesson, you will learn: Good data entry practices - formatting data tables in spreadsheets How to avoid common formatting mistakes Approaches for handling dates in spreadsheets Basic quality control and data manipulation in spreadsheets Exporting data from spreadsheets In this lesson, however, you will not learn about data analysis with spreadsheets. Much of your time as a researcher will be spent in the initial ‘data wrangling’ stage, where you need to organize the data to perform a proper analysis later. It’s not the most fun, but it is necessary. In this lesson you will learn how to think about data organization and some practices for more effective data wrangling. With this approach you can better format current data and plan new data collection so less data wrangling is needed.
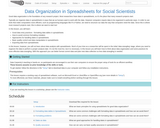
Lesson on spreadsheets for social scientists. Good data organization is the foundation …
Lesson on spreadsheets for social scientists. Good data organization is the foundation of any research project. Most researchers have data in spreadsheets, so it’s the place that many research projects start. Typically we organize data in spreadsheets in ways that we as humans want to work with the data. However computers require data to be organized in particular ways. In order to use tools that make computation more efficient, such as programming languages like R or Python, we need to structure our data the way that computers need the data. Since this is where most research projects start, this is where we want to start too! In this lesson, you will learn: Good data entry practices - formatting data tables in spreadsheets How to avoid common formatting mistakes Approaches for handling dates in spreadsheets Basic quality control and data manipulation in spreadsheets Exporting data from spreadsheets In this lesson, however, you will not learn about data analysis with spreadsheets. Much of your time as a researcher will be spent in the initial ‘data wrangling’ stage, where you need to organize the data to perform a proper analysis later. It’s not the most fun, but it is necessary. In this lesson you will learn how to think about data organization and some practices for more effective data wrangling. With this approach you can better format current data and plan new data collection so less data wrangling is needed.
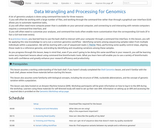
Data Carpentry lesson to learn how to use command-line tools to perform …
Data Carpentry lesson to learn how to use command-line tools to perform quality control, align reads to a reference genome, and identify and visualize between-sample variation. A lot of genomics analysis is done using command-line tools for three reasons: 1) you will often be working with a large number of files, and working through the command-line rather than through a graphical user interface (GUI) allows you to automate repetitive tasks, 2) you will often need more compute power than is available on your personal computer, and connecting to and interacting with remote computers requires a command-line interface, and 3) you will often need to customize your analyses, and command-line tools often enable more customization than the corresponding GUI tools (if in fact a GUI tool even exists). In a previous lesson, you learned how to use the bash shell to interact with your computer through a command line interface. In this lesson, you will be applying this new knowledge to carry out a common genomics workflow - identifying variants among sequencing samples taken from multiple individuals within a population. We will be starting with a set of sequenced reads (.fastq files), performing some quality control steps, aligning those reads to a reference genome, and ending by identifying and visualizing variations among these samples. As you progress through this lesson, keep in mind that, even if you aren’t going to be doing this same workflow in your research, you will be learning some very important lessons about using command-line bioinformatic tools. What you learn here will enable you to use a variety of bioinformatic tools with confidence and greatly enhance your research efficiency and productivity.
Software Carpentry lesson that teaches how to use databases and SQL In …
Software Carpentry lesson that teaches how to use databases and SQL In the late 1920s and early 1930s, William Dyer, Frank Pabodie, and Valentina Roerich led expeditions to the Pole of Inaccessibility in the South Pacific, and then onward to Antarctica. Two years ago, their expeditions were found in a storage locker at Miskatonic University. We have scanned and OCR the data they contain, and we now want to store that information in a way that will make search and analysis easy. Three common options for storage are text files, spreadsheets, and databases. Text files are easiest to create, and work well with version control, but then we would have to build search and analysis tools ourselves. Spreadsheets are good for doing simple analyses, but they don’t handle large or complex data sets well. Databases, however, include powerful tools for search and analysis, and can handle large, complex data sets. These lessons will show how to use a database to explore the expeditions’ data.
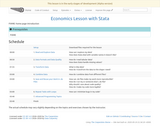
A Data Carpentry curriculum for Economics is being developed by Dr. Miklos …
A Data Carpentry curriculum for Economics is being developed by Dr. Miklos Koren at Central European University. These materials are being piloted locally. Development for these lessons has been supported by a grant from the Sloan Foundation.
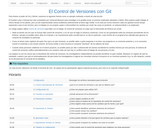
Software Carpentry lección para control de versiones con Git Para ilustrar el …
Software Carpentry lección para control de versiones con Git Para ilustrar el poder de Git y GitHub, usaremos la siguiente historia como un ejemplo motivador a través de esta lección. El Hombre Lobo y Drácula han sido contratados por Universal Missions para investigar si es posible enviar su próximo explorador planetario a Marte. Ellos quieren poder trabajar al mismo tiempo en los planes, pero ya han experimentado ciertos problemas anteriormente al hacer algo similar. Si se rotan por turnos entonces cada uno gastará mucho tiempo esperando a que el otro termine, pero si trabajan en sus propias copias e intercambian los cambios por email, las cosas se perderán, se sobreescribirán o se duplicarán. Un colega sugiere utilizar control de versiones para lidiar con el trabajo. El control de versiones es mejor que el intercambio de ficheros por email: Nada se pierde una vez que se incluye bajo control de versiones, a no ser que se haga un esfuerzo sustancial. Como se van guardando todas las versiones precedentes de los ficheros, siempre es posible volver atrás en el tiempo y ver exactamente quién escribió qué en un día en particular, o qué versión de un programa fue utilizada para generar un conjunto de resultados en particular. Como se tienen estos registros de quién hizo qué y en qué momento, es posible saber a quién preguntar si se tiene una pregunta en un momento posterior y, si es necesario, revertir el contenido a una versión anterior, de forma similar a como funciona el comando “deshacer” de los editores de texto. Cuando varias personas colaboran en el mismo proyecto, es posible pasar por alto o sobreescribir de manera accidental los cambios hechos por otra persona. El sistema de control de versiones notifica automáticamente a los usuarios cada vez que hay un conflicto entre el trabajo de una persona y la otra. Los equipos no son los únicos que se benefician del control de versiones: los investigadores independientes se pueden beneficiar en gran medida. Mantener un registro de qué ha cambiado, cuándo y por qué es extremadamente útil para todos los investigadores si alguna vez necesitan retomar el proyecto en un momento posterior (e.g. un año después, cuando se ha desvanecido el recuerdo de los detalles).
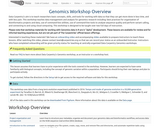
Workshop overview for the Data Carpentry genomics curriculum. Data Carpentry’s aim is …
Workshop overview for the Data Carpentry genomics curriculum. Data Carpentry’s aim is to teach researchers basic concepts, skills, and tools for working with data so that they can get more done in less time, and with less pain. This workshop teaches data management and analysis for genomics research including: best practices for organization of bioinformatics projects and data, use of command-line utilities, use of command-line tools to analyze sequence quality and perform variant calling, and connecting to and using cloud computing. This workshop is designed to be taught over two full days of instruction. Please note that workshop materials for working with Genomics data in R are in “alpha” development. These lessons are available for review and for informal teaching experiences, but are not yet part of The Carpentries’ official lesson offerings. Interested in teaching these materials? We have an onboarding video and accompanying slides available to prepare Instructors to teach these lessons. After watching this video, please contact team@carpentries.org so that we can record your status as an onboarded Instructor. Instructors who have completed onboarding will be given priority status for teaching at centrally-organized Data Carpentry Genomics workshops.
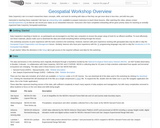
Data Carpentry’s aim is to teach researchers basic concepts, skills, and tools …
Data Carpentry’s aim is to teach researchers basic concepts, skills, and tools for working with data so that they can get more done in less time, and with less pain. Interested in teaching these materials? We have an onboarding video available to prepare Instructors to teach these lessons. After watching this video, please contact team@carpentries.org so that we can record your status as an onboarded Instructor. Instructors who have completed onboarding will be given priority status for teaching at centrally-organized Data Carpentry Geospatial workshops.
No restrictions on your remixing, redistributing, or making derivative works. Give credit to the author, as required.
Your remixing, redistributing, or making derivatives works comes with some restrictions, including how it is shared.
Your redistributing comes with some restrictions. Do not remix or make derivative works.
Most restrictive license type. Prohibits most uses, sharing, and any changes.
Copyrighted materials, available under Fair Use and the TEACH Act for US-based educators, or other custom arrangements. Go to the resource provider to see their individual restrictions.