This video lesson uses the technique of induction to show students how …
This video lesson uses the technique of induction to show students how to analyze a seemingly random occurrence in order to understand it through the development of a mathematical model. Using the medium of a simple game, Dr. Lodhi demonstrates how students can first apply the 'rules' to small examples of the game and then, through careful observation, can begin to see the emergence of a possible pattern. Students will learn that they can move from observing a pattern to proving that their observation is correct by the development of a mathematical model. Dr. Lodhi provides a second game for students in the Teacher Guide downloadable on this page. There are no prerequisites for this lesson and needed materials include only a blackboard and objects of two different varieties - such as plain and striped balls, apples and oranges, etc. The lesson can be completed in a 50-minute class period.
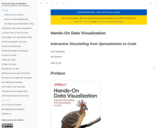
Tell your story and show it with data, using free and easy-to-learn …
Tell your story and show it with data, using free and easy-to-learn tools on the web. This introductory book teaches you how to design interactive charts and customized maps for your website, beginning with easy drag-and-drop tools, such as Google Sheets, Datawrapper, and Tableau Public. You’ll also gradually learn how to edit open-source code templates built with Chart.js, Highcharts, and Leaflet on GitHub.
Hands-On Data Visualization takes you step-by-step through tutorials, real-world examples, and online resources. This book is ideal for students, educators, community activists, non-profit organizations, small business owners, local governments, journalists, researchers, or anyone who wants to take data out of spreadsheets and turn it into lively interactive stories. No coding experience is required.
Learn more about this open-access web edition, based on the book manuscript we submitted to our publisher, O’Reilly Media, Inc., which we have permission to freely share under the terms of our contract. Readers may purchase the publisher’s improved and copyedited version, in print or ebook editions. Figure numbering and other details vary between this open-access web edition and the publisher’s editions.
This activity provides an excellent example of an active debate within the …
This activity provides an excellent example of an active debate within the scientific community regarding a relatively recent human fossil find, Homo floresiensis. The activity highlights the ways in which scientists can interpret scientific evidence in different ways, how scientists build arguments to support their claims, and how assumptions can influence interpretation. Students watch part of a NOVA program on the fossil find, and take notes on the evidence discussed. They then discuss in small groups and then as a large group which argument they consider more convincing and why.
Perhaps the first skill needed for successful quantitative reasoning is the ability …
Perhaps the first skill needed for successful quantitative reasoning is the ability to understand a single number. Newspaper headlines over the last year have used some amazingly large figures when discussing the national debt, bailout funds, corporate bonuses, or economic stimulus packages. Millions, billions, and trillions of dollars are often encountered in such stories. The ability to process these large values and compare their relative values is essential in understanding the financial nuances to such articles. This example contains two in-depth approaches to understanding large quantities.
This lesson provides guidance for students to create and practice a presentation …
This lesson provides guidance for students to create and practice a presentation about design challenge results that they developed in the previous unit lessons and how to present it to the school administration.
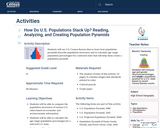
Students will use U.S. Census Bureau data to learn how population pyramids …
Students will use U.S. Census Bureau data to learn how population pyramids describe population structures and to calculate age range population percentages for a selected state that will help them create a population pyramid.
Students will collect, organize, and compare data about the number of girls …
Students will collect, organize, and compare data about the number of girls and the number of boys in their classroom who play sports, take lessons, and participate in clubs. Then students will compare these classroom data with U.S. Census Bureau data for girls and boys across the United States. Teachers may choose to adapt this activity for different data if other categories are more applicable to their students.
The teacher will facilitate a class discussion for students to share their …
The teacher will facilitate a class discussion for students to share their opinions about young adulthood before they start the activity. After some teacher modeling, students will read, annotate, and answer questions about a technical document—including tables and graphs—to gather evidence to support conversations with their classmates about young adulthood. Then, students will write a paragraph about how their generation defines young adulthood.
This course is an introduction to data cleaning, analysis and visualization. We …
This course is an introduction to data cleaning, analysis and visualization. We will teach the basics of data analysis through concrete examples. You will learn how to take raw data, extract meaningful information, use statistical tools, and make visualizations. This was offered as a non-credit course during the Independent Activities Period (IAP), which is a special 4-week term at MIT that runs from the first week of January until the end of the month.
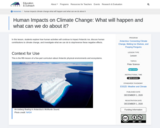
In this lesson, students explore how human activities will continue to impact …
In this lesson, students explore how human activities will continue to impact Antarctic ice, discuss human contributions to climate change, and investigate what we can do to stop/reverse these negative effects.
Using thermometers, cotton balls, string and water, students make simple psychrometers—a tool …
Using thermometers, cotton balls, string and water, students make simple psychrometers—a tool that measures humidity. They learn the difference between relative humidity (the ratio of water vapor content to water vapor carrying capacity) and dew point (the temperature at which dew forms). Teams collect data using their homemade psychrometers and then calculate relative humidity inside and outside, comparing their results to an off-the-shelf psychrometer (if available). A lab worksheet is provided for data collection and calculation. As a real-world connection, students learn that humidity and air density is taken into consideration by engineers for many design projects. To conclude, they answer and discuss analysis and application questions.
This model-eliciting activity (MEA) challenges students to develop a model for predicting …
This model-eliciting activity (MEA) challenges students to develop a model for predicting the characteristics of a person who has committed a crime. Students work with real data on shoe length, height, and gender to develop the model. Students write a report to the crime victim that identifies a suspect and justifies their decision. The activity sets the stage for students to learn about regression models, and reinforces their understanding of central tendency and variability. It is suggested that this activity be used prior to a formal introduction to linear relationships.
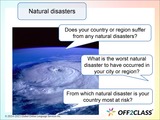
The purpose of this lesson is to introduce vocabulary around natural disasters. …
The purpose of this lesson is to introduce vocabulary around natural disasters. This natural disasters lesson plan contains controlled and free tasks to promote fluency in speaking. This lesson does not include a reading activity. It is an intermediate-level lesson plan that contains matching activities, speaking prompts, quote analysis, data analysis, and opinion questions. With all that said, this lesson plan will allow you to learn a lot about your student and their opinions on different topics.If you want additional lesson plans and support, including teachers’ notes, be sure to register for a free Off2Class account.
Objectives Part 1: An Introduction to Data Analysis Using Excel To interpret, …
Objectives Part 1: An Introduction to Data Analysis Using Excel To interpret, summarize and present numerical data using the digital tool Microsoft program Excel. To plot numerical data as a graph and determine an equation of a line. In addition, using the appropriate formatting functions to label your graph and creating a best fit line. Part 2: Lab Report Writing Using LaGCC Institutional Data To communicate your interpretations of research data. This is done writing discussions and conclusions (using scientific language) and is often accompanied by data tables and graphs. To use your Microsoft Excel graphing skills to interpret, inquire and extrapolate meaning data to support your lab report conclusions To structure your written lab report in the format of: Abstract, Introduction, Material, Methods,Results, Discussion/Conclusion and References
This activity introduces students to loading and plotting data in MATLAB. Students …
This activity introduces students to loading and plotting data in MATLAB. Students explore scalar and vector time series and profile data commonly used in the field of Oceanography using data sets from publicly available sources or that they collected in local waters.
This textbook and its supplements, including slides, labs, and interactive tutorials, may be downloaded for free at openintro.org/book/ims.
This textbook is a derivative of OpenIntro Statistics 4th Edition and Introduction to Statistics with Randomization and Simulation 1st Edition by Diez, Barr, and Çetinkaya-Rundel, and it’s available under a Creative Commons Attribution-ShareAlike 3.0 Unported United States License. License details are available at the Creative Commons website: creativecommons.org.
Source files for this book may be found on GitHub at github.com/openintrostat/ims.
No restrictions on your remixing, redistributing, or making derivative works. Give credit to the author, as required.
Your remixing, redistributing, or making derivatives works comes with some restrictions, including how it is shared.
Your redistributing comes with some restrictions. Do not remix or make derivative works.
Most restrictive license type. Prohibits most uses, sharing, and any changes.
Copyrighted materials, available under Fair Use and the TEACH Act for US-based educators, or other custom arrangements. Go to the resource provider to see their individual restrictions.