SSAC Physical Volcanology module. Students build a spreadsheet and apply the ideal …
SSAC Physical Volcanology module. Students build a spreadsheet and apply the ideal gas law to model the velocity of a bubble rising in a viscous magma.
(Note: this resource was added to OER Commons as part of a batch upload of over 2,200 records. If you notice an issue with the quality of the metadata, please let us know by using the 'report' button and we will flag it for consideration.)
Lab 1: the students begin by describing on a worksheet their own …
Lab 1: the students begin by describing on a worksheet their own ideas of delta formation using concept sketches and written descriptions of the stages of formation, with only broad guidance from the instructor. They are also asked to describe the key features of their concept sketches, and to hypothesize how those features might develop (the processes). The students have all been exposed to deltas in Physical Geology, but likely only have rudimentary knowledge of them. Once they have completed the worksheet, the entire class moves to a lab with a stream table in it, preset to run a "model delta." The model has both a web cam and a time-lapse web cam set up over the table to record the development. The students help start the water flowing and the cameras recording, then watch as it develops over the next 2-3 days.
Lab 2: In the second lab, we use grain-size analysis of the stream-table delta as a means of testing some of their ideas from lab 1. The students as a class develop a strategy to sample the stream-table delta for grain size, using a laser grain-size analyzer. Each pair of students collect one sample, but are also asked to predict the changes in grain size distribution for samples elsewhere in the delta. The particle size analyzer rapidly provides results to the students near the end of lab.
Lab 3: the final lab is a field trip to a pair of gravel pits that expose the guts of two natural stranded deltas, including topset and foreset beds. The students are asked to assess the landforms on a topo map before arriving, and to describe the deposits at each site we visit. On the final writeup, the students need to synthesize all the elements of the three labs, along with input from our readings in the textbook (Easterbrook) and McPhee's "Control of Nature."Â
(Note: this resource was added to OER Commons as part of a batch upload of over 2,200 records. If you notice an issue with the quality of the metadata, please let us know by using the 'report' button and we will flag it for consideration.)
Building Oscillation Seismic Simulation, or BOSS, is an opportunity for learners to …
Building Oscillation Seismic Simulation, or BOSS, is an opportunity for learners to explore the phenomenon of resonance for different building heights while performing a scientific experiment that employs mathematical skills. They experience how structures behave dynamically during an earthquake.
(Note: this resource was added to OER Commons as part of a batch upload of over 2,200 records. If you notice an issue with the quality of the metadata, please let us know by using the 'report' button and we will flag it for consideration.)
IRIS (Incorporated Research Institutions for Seismology), FEMA (Federal Emergency Management Administration), ShakeAlert, Chris Hedeen (Oregon City High School), and ANGLE Project
Student pairs are given 10 minutes to create the biggest box possible …
Student pairs are given 10 minutes to create the biggest box possible using one piece of construction paper. Teams use only scissors and tape to each construct a box and determine how much puffed rice it can hold. Then, to meet the challenge, they improve their designs to create bigger boxes. They plot the class data, comparing measured to calculated volumes for each box, seeing the mathematical relationship. They discuss how the concepts of volume and design iteration are important for engineers. Making 3-D shapes also supports the development of spatial visualization skills. This activity and its associated lesson and activity all employ volume and geometry to cultivate seeing patterns and understanding scale models, practices used in engineering design to analyze the effectiveness of proposed design solutions.
In this lab exercise, students examine one or more metamorphic rocks and …
In this lab exercise, students examine one or more metamorphic rocks and use various approaches to estimating and calculating the pressure-temperature conditions at which the rocks equilibrated. The exercise involves hand sample description, petrography, interpretation of phase diagrams, and calculations of a phase diagram or P-T conditions from given equations.
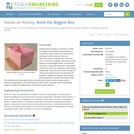
This is a very short exercise designed to get students to understand …
This is a very short exercise designed to get students to understand how the Gibbs energy equation is used to calculate the location of a reaction in P-T space. I use it in-class and have students work on it in groups.
Besides calculating the location of one reactions, students also have to think a bit about the significance of volume and entropy with regard to mineral stability.
This exercise is very straightforward EXCEPT that students get the units (bars, Kbar, cc, etc.) confused.
(Note: this resource was added to OER Commons as part of a batch upload of over 2,200 records. If you notice an issue with the quality of the metadata, please let us know by using the 'report' button and we will flag it for consideration.)
This short video and interactive assessment activity is designed to teach third …
This short video and interactive assessment activity is designed to teach third graders about calculating and comparing capacities with illustrations (metric units).
Science students often have difficulty thinking about large spatial scales. The purpose …
Science students often have difficulty thinking about large spatial scales. The purpose of the exercise is to redo Eratosthenes' calculation of the radius of the Earth using data from to sites in ancient Egypt. The excercise teaches about the methodology of science - how Eratothenes figured it out - rather than worried about what the "right" answer is. It can also be used to discuss the role of models in geological thinking.
(Note: this resource was added to OER Commons as part of a batch upload of over 2,200 records. If you notice an issue with the quality of the metadata, please let us know by using the 'report' button and we will flag it for consideration.)
Project in which students calculate the magnitude of lunar and solar tidal …
Project in which students calculate the magnitude of lunar and solar tidal forces on the earth. They calculate the solar tidal effect relative to the lunar tidal effect and the relative solar tidal effect for spring-tide conditions.
(Note: this resource was added to OER Commons as part of a batch upload of over 2,200 records. If you notice an issue with the quality of the metadata, please let us know by using the 'report' button and we will flag it for consideration.)
Prior to assigning this activity in lecture, students gather information about their …
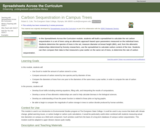
Prior to assigning this activity in lecture, students gather information about their personal energy consumption so that they can calculate their personal carbon footprint. Specifically they need to determine the gas mileage of their vehicle, the average number of miles they drive in a month, and bring to class an electric bill and a natural gas bill from their apartment. I provide the appropriate information for students living in dorms. Their task during the class period is to assemble this information and calculate how much carbon their activities are responsible for generating. Once this portion of the assignment is complete, they investigate options for reducing their carbon emissions and the costs of those options. The pros and cons of carbon-reduction strategies form the basis for the class discussion. Lastly, students are asked to brain storm a list of potential carbon sources that are not included in this simple exercise, such as the carbon required to make the things we buy (computers, edible dinosaurs, q-tips, etc.).
(Note: this resource was added to OER Commons as part of a batch upload of over 2,200 records. If you notice an issue with the quality of the metadata, please let us know by using the 'report' button and we will flag it for consideration.)
An activity where students make a geologic timeline from calculator tape. (Note: …
An activity where students make a geologic timeline from calculator tape.
(Note: this resource was added to OER Commons as part of a batch upload of over 2,200 records. If you notice an issue with the quality of the metadata, please let us know by using the 'report' button and we will flag it for consideration.)
Students are given an outline map of the campus with no scale …
Students are given an outline map of the campus with no scale indicated. They are to work in small groups to determine the scale. Although rules and tape measures are provided, students are given no instruction on how to best determine the scale and are tasked with devising their own methodology. Students write their scales on the blackboard and we finish the class with a discussion of their various methodologies, sources of error, and why there is some variation among their results.
(Note: this resource was added to OER Commons as part of a batch upload of over 2,200 records. If you notice an issue with the quality of the metadata, please let us know by using the 'report' button and we will flag it for consideration.)
Using the Scientific Method, can we know of the existence of Global …
Using the Scientific Method, can we know of the existence of Global Warming? Students will research the question: "Does global warming exit" using and summarizing Scholarly Journals.
This short video and interactive assessment activity is designed to teach second …
This short video and interactive assessment activity is designed to teach second graders about capacity comparison problems with illustrations - word problems.
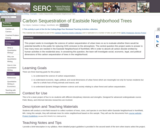
Spreadsheets Across the Curriculum module. Students use allometric relationships to calculate tree …
Spreadsheets Across the Curriculum module. Students use allometric relationships to calculate tree mass from trunk diameter in a stand of trees in the Pacific Northwest.
(Note: this resource was added to OER Commons as part of a batch upload of over 2,200 records. If you notice an issue with the quality of the metadata, please let us know by using the 'report' button and we will flag it for consideration.)
In the first part of the exercise, students examine a variety of …
In the first part of the exercise, students examine a variety of ArcMaps to work out what data sets and techniques were used and to develop a list of the characteristics of effective, attractive, and complete maps. In part 2, students explore a GIS tutorial of cartographic techniques. You might also be interested in our Full GIS course with links to all assignments.
No restrictions on your remixing, redistributing, or making derivative works. Give credit to the author, as required.
Your remixing, redistributing, or making derivatives works comes with some restrictions, including how it is shared.
Your redistributing comes with some restrictions. Do not remix or make derivative works.
Most restrictive license type. Prohibits most uses, sharing, and any changes.
Copyrighted materials, available under Fair Use and the TEACH Act for US-based educators, or other custom arrangements. Go to the resource provider to see their individual restrictions.