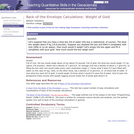
Question Let's suppose that you have a shoe box full of water …
Question Let's suppose that you have a shoe box full of water (the box is waterproof, of course). The shoe box weighs about 9 kg (19.8 pounds). Suppose you emptied the box and filled it completely with rock (little or no air space). How much would it weigh? Let's empty the box again and fill it completely with pure gold. How much would the box weigh now?
(Note: this resource was added to OER Commons as part of a batch upload of over 2,200 records. If you notice an issue with the quality of the metadata, please let us know by using the 'report' button and we will flag it for consideration.)
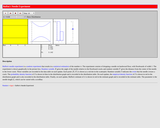
This resource consists of a Java applet and expository text. The applet …
This resource consists of a Java applet and expository text. The applet simulates Buffon's needle experiment and the corresponding approximation of pi. The event of interest is that the needle crosses a crack. The length of the needle can be varied. The applet illustrates a random experiment, the sample space, random variables, probability, and relative frequency.
Lab 1: the students begin by describing on a worksheet their own …
Lab 1: the students begin by describing on a worksheet their own ideas of delta formation using concept sketches and written descriptions of the stages of formation, with only broad guidance from the instructor. They are also asked to describe the key features of their concept sketches, and to hypothesize how those features might develop (the processes). The students have all been exposed to deltas in Physical Geology, but likely only have rudimentary knowledge of them. Once they have completed the worksheet, the entire class moves to a lab with a stream table in it, preset to run a "model delta." The model has both a web cam and a time-lapse web cam set up over the table to record the development. The students help start the water flowing and the cameras recording, then watch as it develops over the next 2-3 days.
Lab 2: In the second lab, we use grain-size analysis of the stream-table delta as a means of testing some of their ideas from lab 1. The students as a class develop a strategy to sample the stream-table delta for grain size, using a laser grain-size analyzer. Each pair of students collect one sample, but are also asked to predict the changes in grain size distribution for samples elsewhere in the delta. The particle size analyzer rapidly provides results to the students near the end of lab.
Lab 3: the final lab is a field trip to a pair of gravel pits that expose the guts of two natural stranded deltas, including topset and foreset beds. The students are asked to assess the landforms on a topo map before arriving, and to describe the deposits at each site we visit. On the final writeup, the students need to synthesize all the elements of the three labs, along with input from our readings in the textbook (Easterbrook) and McPhee's "Control of Nature."Â
(Note: this resource was added to OER Commons as part of a batch upload of over 2,200 records. If you notice an issue with the quality of the metadata, please let us know by using the 'report' button and we will flag it for consideration.)
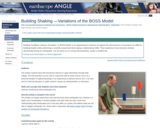
Building Oscillation Seismic Simulation, or BOSS, is an opportunity for learners to …
Building Oscillation Seismic Simulation, or BOSS, is an opportunity for learners to explore the phenomenon of resonance for different building heights while performing a scientific experiment that employs mathematical skills. They experience how structures behave dynamically during an earthquake.
(Note: this resource was added to OER Commons as part of a batch upload of over 2,200 records. If you notice an issue with the quality of the metadata, please let us know by using the 'report' button and we will flag it for consideration.)
IRIS (Incorporated Research Institutions for Seismology), FEMA (Federal Emergency Management Administration), ShakeAlert, Chris Hedeen (Oregon City High School), and ANGLE Project
Introductory survey of quantitative methods (QM), or the application of statistics in …
Introductory survey of quantitative methods (QM), or the application of statistics in the workplace. Examines techniques for gathering, analyzing, and interpreting data in any number of fieldsĺÎĺ from anthropology to hedge fund management.
There is growing body of evidence to support that students who directly …
There is growing body of evidence to support that students who directly experience authentic scientific research are more likely to continue onto advanced degrees and careers in Science, Technology, Engineering and Mathematics (STEM). In an effort to introduce more students to the benefits of scientific research we have drawn on an ongoing research project aimed at understanding how Corals Respond to the Environment (CRE) to develop an interdisciplinary laboratory course based on Authentic Research Experiences (ARE). A small cohort of undergraduate students enrolled in a semester-long course, entitled CREARE, perform biochemical experiments in the laboratory, analyze environmental data by R statistical software and prepared a report modeled after a research manuscript to present their work. The impact of CREARE on student learning gains and attitudes towards science is being measured, as is the impact of CREARE on participants' career choices and retention in STEM. This multidisciplinary research program addresses the impact of climate change on the health of a critically endangered coral species, ultimately leading to a better stewardship of this invaluable resource. Furthermore, CREARE offers a unique experience for students, one that may serve as a model for the development of more research-based courses, leading to improved retention in our STEM departments.
(Note: this resource was added to OER Commons as part of a batch upload of over 2,200 records. If you notice an issue with the quality of the metadata, please let us know by using the 'report' button and we will flag it for consideration.)
This task was developed by high school and postsecondary mathematics and health …
This task was developed by high school and postsecondary mathematics and health sciences educators, and validated by content experts in the Common Core State Standards in mathematics and the National Career Clusters Knowledge & Skills Statements. It was developed with the purpose of demonstrating how the Common Core and CTE Knowledge & Skills Statements can be integrated into classroom learning - and to provide classroom teachers with a truly authentic task for either mathematics or CTE courses.
This is a very short exercise designed to get students to understand …
This is a very short exercise designed to get students to understand how the Gibbs energy equation is used to calculate the location of a reaction in P-T space. I use it in-class and have students work on it in groups.
Besides calculating the location of one reactions, students also have to think a bit about the significance of volume and entropy with regard to mineral stability.
This exercise is very straightforward EXCEPT that students get the units (bars, Kbar, cc, etc.) confused.
(Note: this resource was added to OER Commons as part of a batch upload of over 2,200 records. If you notice an issue with the quality of the metadata, please let us know by using the 'report' button and we will flag it for consideration.)
Project in which students calculate the magnitude of lunar and solar tidal …
Project in which students calculate the magnitude of lunar and solar tidal forces on the earth. They calculate the solar tidal effect relative to the lunar tidal effect and the relative solar tidal effect for spring-tide conditions.
(Note: this resource was added to OER Commons as part of a batch upload of over 2,200 records. If you notice an issue with the quality of the metadata, please let us know by using the 'report' button and we will flag it for consideration.)
Prior to assigning this activity in lecture, students gather information about their …
Prior to assigning this activity in lecture, students gather information about their personal energy consumption so that they can calculate their personal carbon footprint. Specifically they need to determine the gas mileage of their vehicle, the average number of miles they drive in a month, and bring to class an electric bill and a natural gas bill from their apartment. I provide the appropriate information for students living in dorms. Their task during the class period is to assemble this information and calculate how much carbon their activities are responsible for generating. Once this portion of the assignment is complete, they investigate options for reducing their carbon emissions and the costs of those options. The pros and cons of carbon-reduction strategies form the basis for the class discussion. Lastly, students are asked to brain storm a list of potential carbon sources that are not included in this simple exercise, such as the carbon required to make the things we buy (computers, edible dinosaurs, q-tips, etc.).
(Note: this resource was added to OER Commons as part of a batch upload of over 2,200 records. If you notice an issue with the quality of the metadata, please let us know by using the 'report' button and we will flag it for consideration.)
An activity where students make a geologic timeline from calculator tape. (Note: …
An activity where students make a geologic timeline from calculator tape.
(Note: this resource was added to OER Commons as part of a batch upload of over 2,200 records. If you notice an issue with the quality of the metadata, please let us know by using the 'report' button and we will flag it for consideration.)
Students are given an outline map of the campus with no scale …
Students are given an outline map of the campus with no scale indicated. They are to work in small groups to determine the scale. Although rules and tape measures are provided, students are given no instruction on how to best determine the scale and are tasked with devising their own methodology. Students write their scales on the blackboard and we finish the class with a discussion of their various methodologies, sources of error, and why there is some variation among their results.
(Note: this resource was added to OER Commons as part of a batch upload of over 2,200 records. If you notice an issue with the quality of the metadata, please let us know by using the 'report' button and we will flag it for consideration.)
Spreadsheets Across the Curriculum module. Students use allometric relationships to calculate tree …
Spreadsheets Across the Curriculum module. Students use allometric relationships to calculate tree mass from trunk diameter in a stand of trees in the Pacific Northwest.
(Note: this resource was added to OER Commons as part of a batch upload of over 2,200 records. If you notice an issue with the quality of the metadata, please let us know by using the 'report' button and we will flag it for consideration.)
A case-study approach can be used to introduce students to the work …
A case-study approach can be used to introduce students to the work that geologists do as environmental consultants. Data used by environmental consultants for a Brownfield site that is currently undergoing redevelopment in St. Paul, MN has been adapted for in-class study, either as a series of short exercises, or as part of a larger project.
(Note: this resource was added to OER Commons as part of a batch upload of over 2,200 records. If you notice an issue with the quality of the metadata, please let us know by using the 'report' button and we will flag it for consideration.)
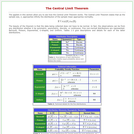
The applets in this section of Statistical Java allow you to see …
The applets in this section of Statistical Java allow you to see how the Central Limit Theorem works. The main page gives the characteristics of five non-normal distributions (Bernoulli, Poisson, Exponential, U-shaped, and Uniform).
This video talka about what is easily one of the most fundamental …
This video talka about what is easily one of the most fundamental and profound concepts in statistics and maybe in all of mathematics. And that's the central limit theorem.
The purpose of this assignment is for students to synthesize field observations, …
The purpose of this assignment is for students to synthesize field observations, petrography, and whole-rock chemical analyses in order to investigate chemical differentiation processes in a basaltic magma chamber. The students first complete a petrography lab on both hand samples and thin sections that represent a complete stratigraphic section through sill at Fort Lee, NJ. I then provide them with major- and trace-element data and a table of distribution coefficients for common phases that would be crystallizing from basaltic magma. I then ask them to discuss the chemical differentiation of the sill by writing up a 1-2 page interpretative summary based on their petrographic observations and the chemical data.
(Note: this resource was added to OER Commons as part of a batch upload of over 2,200 records. If you notice an issue with the quality of the metadata, please let us know by using the 'report' button and we will flag it for consideration.)
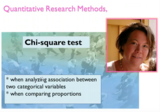
An introduction and examples of how to use the Chi square test. …
An introduction and examples of how to use the Chi square test. The test is used when analyzing assocation between two categorical variables and when comparing proportions. The idea behind the test is to compare the observed frequencies with the expected frequencies, if the two variables are unrelated.
No restrictions on your remixing, redistributing, or making derivative works. Give credit to the author, as required.
Your remixing, redistributing, or making derivatives works comes with some restrictions, including how it is shared.
Your redistributing comes with some restrictions. Do not remix or make derivative works.
Most restrictive license type. Prohibits most uses, sharing, and any changes.
Copyrighted materials, available under Fair Use and the TEACH Act for US-based educators, or other custom arrangements. Go to the resource provider to see their individual restrictions.