This resource consists of a Java applet and expository text. The applet …
This resource consists of a Java applet and expository text. The applet simulates Bernoulli trials in terms of random points on a timeline. The random variables of interest are the number of successes and the proportion of successes. The number of trials and the probability of success can be varied. This applet illustrates the law of large numbers, the central limit theorem, and the binomial distribution.
This textbook provides a survey of statistical methods commonly used in the …
This textbook provides a survey of statistical methods commonly used in the life sciences, an introduction to statistical theory, and significant exposure to the statistical software package SAS 9.4. The textbook is designed for graduate students and upper division undergraduates, and assumes some familiarity with mathematical notation, functions, and algebra. No previous courses in statistics are needed. For those interested in using the software package R, programs similar in function to the SAS ones are also provided. A unique feature of this textbook is the integration of statistical procedures and theory. Most introductory texts present the statistical procedures and a mechanistic explanation of how they work, without discussing the underlying theory. Some knowledge of this theory is essential for students in the life sciences, especially graduate students, and so the textbook uses likelihood theory to explain how parameters are estimated and statistical tests derived. The statistical models for ANOVA, regression, and other common procedures are also presented. These theoretical concepts are presented in both equation and graphical form. For detailed information on the topics covered in this textbook, see the Table of Contents file in Section 1.
This resource consists of a Java applet and expository text. The applet …
This resource consists of a Java applet and expository text. The applet simulates the bivariate normal distribution. The means are set at 0, but the standard deviations and the correlation can be varied. Simulated points from the distribution are shown as dots in a scatterplot.
This resource consists of a Java applet and expository text. The Java …
This resource consists of a Java applet and expository text. The Java applet illustrates the bivariate uniform distribution on three types of regions: a square, a circle, and a triangle. Simulated points from the distribution are shown as dots in a scatterplot.
Question Suppose that you are building a new house. It will take …
Question Suppose that you are building a new house. It will take about 90 kg (198 pounds) of copper to do the electrical wiring. In order to get the copper in the first place, someone needs to mine solid rock that contains copper, extract the copper minerals, throw away the waste rock, and smelt the copper minerals to produce copper metal. Rocks mined for copper typically contain only very small percentages of copper -- about 0.7% in the case of most of the big porphyry copper deposits of the world. How much rock would someone have to mine in order to extract enough copper to wire your new house?
(Note: this resource was added to OER Commons as part of a batch upload of over 2,200 records. If you notice an issue with the quality of the metadata, please let us know by using the 'report' button and we will flag it for consideration.)
Question In 1983, an eruption began at Kilauea Volcano in Hawaii that …
Question In 1983, an eruption began at Kilauea Volcano in Hawaii that has proved to be the largest and longest-lived eruption since records began in 1823. Lava has poured out of the volcano at an average rate of about 160 million m3 per year. To put those flow rates into perspective, let's suppose that the volcano was erupting directly into your classroom. At these flow rates, how long would it take to fill your classroom with lava?
(Note: this resource was added to OER Commons as part of a batch upload of over 2,200 records. If you notice an issue with the quality of the metadata, please let us know by using the 'report' button and we will flag it for consideration.)
This book is used in Reach Higher, Oklahoma's adult degree completion program, …
This book is used in Reach Higher, Oklahoma's adult degree completion program, for a course called Data Analysis & Interpretation. It provides basic statistics that can be used for organizational data analysis by individuals with managerial professional goals, while also teaching essential skills from Microsoft Excel commonly needed for data analysis. This book uses material from Lumen Learning's Boundless Statistics (Boundless Learning) and Excel for Decision Making from University of Houston Libraries (multiple authors).
SSAC Physical Volcanology module. Students build a spreadsheet and apply the ideal …
SSAC Physical Volcanology module. Students build a spreadsheet and apply the ideal gas law to model the velocity of a bubble rising in a viscous magma.
(Note: this resource was added to OER Commons as part of a batch upload of over 2,200 records. If you notice an issue with the quality of the metadata, please let us know by using the 'report' button and we will flag it for consideration.)
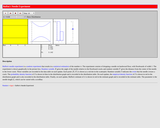
This resource consists of a Java applet and expository text. The applet …
This resource consists of a Java applet and expository text. The applet simulates Buffon's needle experiment and the corresponding approximation of pi. The event of interest is that the needle crosses a crack. The length of the needle can be varied. The applet illustrates a random experiment, the sample space, random variables, probability, and relative frequency.
Lab 1: the students begin by describing on a worksheet their own …
Lab 1: the students begin by describing on a worksheet their own ideas of delta formation using concept sketches and written descriptions of the stages of formation, with only broad guidance from the instructor. They are also asked to describe the key features of their concept sketches, and to hypothesize how those features might develop (the processes). The students have all been exposed to deltas in Physical Geology, but likely only have rudimentary knowledge of them. Once they have completed the worksheet, the entire class moves to a lab with a stream table in it, preset to run a "model delta." The model has both a web cam and a time-lapse web cam set up over the table to record the development. The students help start the water flowing and the cameras recording, then watch as it develops over the next 2-3 days.
Lab 2: In the second lab, we use grain-size analysis of the stream-table delta as a means of testing some of their ideas from lab 1. The students as a class develop a strategy to sample the stream-table delta for grain size, using a laser grain-size analyzer. Each pair of students collect one sample, but are also asked to predict the changes in grain size distribution for samples elsewhere in the delta. The particle size analyzer rapidly provides results to the students near the end of lab.
Lab 3: the final lab is a field trip to a pair of gravel pits that expose the guts of two natural stranded deltas, including topset and foreset beds. The students are asked to assess the landforms on a topo map before arriving, and to describe the deposits at each site we visit. On the final writeup, the students need to synthesize all the elements of the three labs, along with input from our readings in the textbook (Easterbrook) and McPhee's "Control of Nature."Â
(Note: this resource was added to OER Commons as part of a batch upload of over 2,200 records. If you notice an issue with the quality of the metadata, please let us know by using the 'report' button and we will flag it for consideration.)
Introductory survey of quantitative methods (QM), or the application of statistics in …
Introductory survey of quantitative methods (QM), or the application of statistics in the workplace. Examines techniques for gathering, analyzing, and interpreting data in any number of fieldsĺÎĺ from anthropology to hedge fund management.
There is growing body of evidence to support that students who directly …
There is growing body of evidence to support that students who directly experience authentic scientific research are more likely to continue onto advanced degrees and careers in Science, Technology, Engineering and Mathematics (STEM). In an effort to introduce more students to the benefits of scientific research we have drawn on an ongoing research project aimed at understanding how Corals Respond to the Environment (CRE) to develop an interdisciplinary laboratory course based on Authentic Research Experiences (ARE). A small cohort of undergraduate students enrolled in a semester-long course, entitled CREARE, perform biochemical experiments in the laboratory, analyze environmental data by R statistical software and prepared a report modeled after a research manuscript to present their work. The impact of CREARE on student learning gains and attitudes towards science is being measured, as is the impact of CREARE on participants' career choices and retention in STEM. This multidisciplinary research program addresses the impact of climate change on the health of a critically endangered coral species, ultimately leading to a better stewardship of this invaluable resource. Furthermore, CREARE offers a unique experience for students, one that may serve as a model for the development of more research-based courses, leading to improved retention in our STEM departments.
(Note: this resource was added to OER Commons as part of a batch upload of over 2,200 records. If you notice an issue with the quality of the metadata, please let us know by using the 'report' button and we will flag it for consideration.)
This is a very short exercise designed to get students to understand …
This is a very short exercise designed to get students to understand how the Gibbs energy equation is used to calculate the location of a reaction in P-T space. I use it in-class and have students work on it in groups.
Besides calculating the location of one reactions, students also have to think a bit about the significance of volume and entropy with regard to mineral stability.
This exercise is very straightforward EXCEPT that students get the units (bars, Kbar, cc, etc.) confused.
(Note: this resource was added to OER Commons as part of a batch upload of over 2,200 records. If you notice an issue with the quality of the metadata, please let us know by using the 'report' button and we will flag it for consideration.)
A case-study approach can be used to introduce students to the work …
A case-study approach can be used to introduce students to the work that geologists do as environmental consultants. Data used by environmental consultants for a Brownfield site that is currently undergoing redevelopment in St. Paul, MN has been adapted for in-class study, either as a series of short exercises, or as part of a larger project.
(Note: this resource was added to OER Commons as part of a batch upload of over 2,200 records. If you notice an issue with the quality of the metadata, please let us know by using the 'report' button and we will flag it for consideration.)
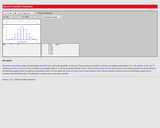
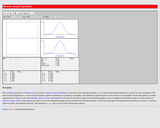
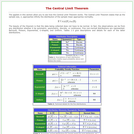
The applets in this section of Statistical Java allow you to see …
The applets in this section of Statistical Java allow you to see how the Central Limit Theorem works. The main page gives the characteristics of five non-normal distributions (Bernoulli, Poisson, Exponential, U-shaped, and Uniform).
The purpose of this assignment is for students to synthesize field observations, …
The purpose of this assignment is for students to synthesize field observations, petrography, and whole-rock chemical analyses in order to investigate chemical differentiation processes in a basaltic magma chamber. The students first complete a petrography lab on both hand samples and thin sections that represent a complete stratigraphic section through sill at Fort Lee, NJ. I then provide them with major- and trace-element data and a table of distribution coefficients for common phases that would be crystallizing from basaltic magma. I then ask them to discuss the chemical differentiation of the sill by writing up a 1-2 page interpretative summary based on their petrographic observations and the chemical data.
(Note: this resource was added to OER Commons as part of a batch upload of over 2,200 records. If you notice an issue with the quality of the metadata, please let us know by using the 'report' button and we will flag it for consideration.)
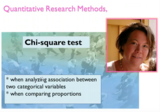
An introduction and examples of how to use the Chi square test. …
An introduction and examples of how to use the Chi square test. The test is used when analyzing assocation between two categorical variables and when comparing proportions. The idea behind the test is to compare the observed frequencies with the expected frequencies, if the two variables are unrelated.
No restrictions on your remixing, redistributing, or making derivative works. Give credit to the author, as required.
Your remixing, redistributing, or making derivatives works comes with some restrictions, including how it is shared.
Your redistributing comes with some restrictions. Do not remix or make derivative works.
Most restrictive license type. Prohibits most uses, sharing, and any changes.
Copyrighted materials, available under Fair Use and the TEACH Act for US-based educators, or other custom arrangements. Go to the resource provider to see their individual restrictions.