An infographic can be used to display a concept graphically. For your …
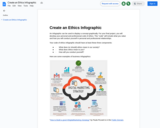
An infographic can be used to display a concept graphically. For your final project, you will develop your personal and professional code of ethics. This "code" will include what you value and how you will conduct yourself in personal and professional relationships.
Your code of ethics infographic should have at least these three components:
- What does (or should) ethics mean in our society? - What does ethics mean to you? - How will you conduct yourself?
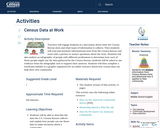
Teachers will engage students in a discussion about what the Census Bureau …
Teachers will engage students in a discussion about what the Census Bureau does and what types of information it collects. Then students will read and annotate informational texts from the Census Bureau and work with a partner to answer questions about the texts. Students will also analyze an infographic of people with different professions to determine how each of those people might use the data gathered by the Census Bureau; students will be asked to use evidence from the infographic text to support their answers. Students will then complete a wireframe (similar to a graphic organizer) for an online resource about how census data can help their own community.
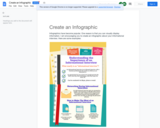
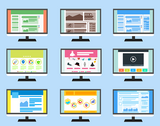
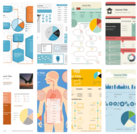
Infographics have become popular. One reason is that you can visually display …
Infographics have become popular. One reason is that you can visually display information. I am encouraging you to create an infographic about your informational interview. This provides some examples.
The goal for this lesson is to increase student comprehension and problem-solving …
The goal for this lesson is to increase student comprehension and problem-solving skills by emphasizing real-world problems and encouraging students to be proactive in solving those problems. Description of classroom, grade level, and students: This assignment is for a 10th grade English II classroom, ranging from AP to standard student populations.Prior Knowledge of Subject: Students possess a prior knowledge about tornado activity, severe thunderstorms, and earthquakes due to living in Oklahoma.Length of Lesson: Students will be allotted 10 class periods of 45 minutes in class. They are also allowed to work on this assignment outside of class, if needed.
This resource was created for first time individuals who are looking to …
This resource was created for first time individuals who are looking to meditate. It also serves as an example of a job aide or infographic. This was created as a part of a larger course on meditation.
This unit engages students in a variety of activities that analyze and …
This unit engages students in a variety of activities that analyze and reflect on the role of social media in our everyday lives. This includes options for collaborative group work, reading nonfiction articles, a design challenge and presentations to communicate ideas. The unit also includes a formal writing assessment option that aligns with the Common Core State Writing Standards. Activities can be adapted or combined in a variety of ways to support student reflection and analysis. These lessons were piloted in 9th grade English classes but are suitable or a range of secondary students.
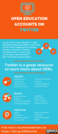
This infographic is an introduction to using the social media platform Twitter …
This infographic is an introduction to using the social media platform Twitter to learn more about open education and open educational resources (OER). The infographic contains recommendations on groups, people, and hashtags to follow. There is a link to a spreadsheet if you are interested in an even longer list of Twitter accounts to follow.This resource was created to fulfill requirements in the SPARC #LeadOER Open Education Leadership Program.
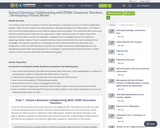
This module is part of the Foundations of School Librarianship on using …
This module is part of the Foundations of School Librarianship on using web resources to enhance collaboration between STEM classroom teachers and school librarians, with special emphasis on STEM subjects. The module is built around the understanding and use of data to support classroom projects. The module describes a process by which the school librarian and teacher will collaborate on a high school-level project to explore how to find, evaluate, and use data to produce an infographic. Infographics are increasingly important as a vehicle for explaining complex subjects. They are a wonderful blend of data and information to create meaning and new knowledge. This module is intended as a 'stretching' exercise for school librarians who often have scant background in STEM. The skills learned by school librarian students revolve around identifying data sources, developing evaluative skills, translating data into an infographic, and working with classroom teachers in STEM subject to match resources with teacher identified learning goals.
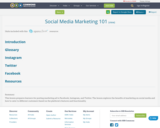
This lesson prepares learners for posting marketing ad to Facebook, Instagram, and …
This lesson prepares learners for posting marketing ad to Facebook, Instagram, and Twitter. The lesson explores the benefits of marketing on social media and how to cater to different customers based on the platform's features and functionality.
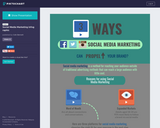
Infograph designed to be used in conjunction with the corresponding learning objective. …
Infograph designed to be used in conjunction with the corresponding learning objective. Highlights pros and cons of three social media platforms...Facebook, Instagram, Twitter.
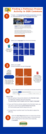
The Cambrian College Teaching & Learning Innovation Hub has created a series …
The Cambrian College Teaching & Learning Innovation Hub has created a series of syllabus templates designed as infographics.
These templates have been created in PowerPoint to assist educators in developing and customizing a more visual introduction to their course. These illustrative templates are simple so that your students can have an easy-to-digest and engaging overview of your course. The syllabus is often the first piece of information that students will receive in their course. They often refer to this to help them become oriented with the course activities and assessments; it’s an important element to their success.
Visit our website to download the templates individually by hovering over the previews and clicking the “Download Template” button to receive the single PowerPoint file. To receive all of the templates as a ZIP file package, click the “Download All Templates” button.
For help in customizing the templates in PowerPoint, we have also included a short how-to video.
These templates by Cambrian College are licensed under CC-BY-NC-SA 4.0.
William Edward Burghardt “W. E. B.” Du Bois — sociologist, historian, activist, …
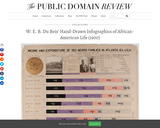
William Edward Burghardt “W. E. B.” Du Bois — sociologist, historian, activist, Pan-Africanist, and prolific author — had also, it turns out, a mighty fine eye for graphic design. Born in Great Barrington, Massachusetts in 1868, Du Bois studied at Fisk University, Humboldt University in Berlin, and Harvard (where he was the first African American to earn a doctorate), and in 1897 he became a professor of history, sociology and economics at Atlanta University. Two years later he published his first major academic work The Philadelphia Negro (1899), a detailed and comprehensive sociological study of the African-American people of Philadelphia, based on his earlier field work. The following year, along with collaborators Thomas J. Calloway and Daniel Murray, Du Bois travelled to Europe, firstly to the First Pan-African Conference held in London, and then to the Paris Exposition to present a groundbreaking exhibition on the state of African-American life — “The Exhibit of American Negroes” — which, according to Du Bois, attempted to show “(a) The history of the American Negro. (b) His present condition. (c) His education. (d) His literature.”
In addition to an extensive collection of photographs, four volumes containing 400 official patents by African Americans, more than 200 books penned by African-American authors, various maps, and a statuette of Frederick Douglass, the exhibition featured a total of fifty-eight stunning hand-drawn charts (a selection of which we present below). Created by Du Bois and his students at Atlanta, the charts, many of which focus on economic life in Georgia, managed to condense an enormous amount of data into a set of aesthetically daring and easily digestible visualisations. As Alison Meier notes in Hyperallergic, “they’re strikingly vibrant and modern, almost anticipating the crossing lines of Piet Mondrian or the intersecting shapes of Wassily Kandinsky”.
No restrictions on your remixing, redistributing, or making derivative works. Give credit to the author, as required.
Your remixing, redistributing, or making derivatives works comes with some restrictions, including how it is shared.
Your redistributing comes with some restrictions. Do not remix or make derivative works.
Most restrictive license type. Prohibits most uses, sharing, and any changes.
Copyrighted materials, available under Fair Use and the TEACH Act for US-based educators, or other custom arrangements. Go to the resource provider to see their individual restrictions.