This article provides a brief discussion of the importance of teaching students …
This article provides a brief discussion of the importance of teaching students to analyze data and representations of data as well as two resources that can help teachers implement these strategies into their instruction.
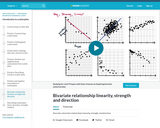
Describe a bivariate relationship's linearity, strength, and direction. In other words, plotting …
Describe a bivariate relationship's linearity, strength, and direction. In other words, plotting things that take two variables into consideration and trying to see whether there's a pattern with how they relate.
This book is used in Reach Higher, Oklahoma's adult degree completion program, …
This book is used in Reach Higher, Oklahoma's adult degree completion program, for a course called Data Analysis & Interpretation. It provides basic statistics that can be used for organizational data analysis by individuals with managerial professional goals, while also teaching essential skills from Microsoft Excel commonly needed for data analysis. This book uses material from Lumen Learning's Boundless Statistics (Boundless Learning) and Excel for Decision Making from University of Houston Libraries (multiple authors).
In this math activity, students conduct a strength test using modeling clay, …
In this math activity, students conduct a strength test using modeling clay, creating their own stress vs. strain graphs, which they compare to typical steel and concrete graphs. They learn the difference between brittle and ductile materials and how understanding the strength of materials, especially steel and concrete, is important for engineers who design bridges and structures.
Students learn a simple technique for quantifying the amount of photosynthesis that …
Students learn a simple technique for quantifying the amount of photosynthesis that occurs in a given period of time, using a common water plant (Elodea). They can use this technique to compare the amounts of photosynthesis that occur under conditions of low and high light levels. Before they begin the experiment, however, students must come up with a well-worded hypothesis to be tested. After running the experiment, students pool their data to get a large sample size, determine the measures of central tendency of the class data, and then graph and interpret the results.
Using this lesson worksheet, computers and a simple programming interface, students step …
Using this lesson worksheet, computers and a simple programming interface, students step through and build a simple program to sequentially calculate all of the variables in the Hardy Weinberg equations. By building the program in sequence it is hoped that students will learn the sequence to solve a Hardy Weinberg problem and appreciate the value and power of computer number crunching capabilities as well as sequential programming considerations.
By building a program to determine the valence of ANY element on …
By building a program to determine the valence of ANY element on the first three rows of the Periodic table, students learn the steps to solve the problem while learning how to program logic and think about processing data in sequence. NOTE: The worksheet includes the option of letting students create a bug that they have to fix.
Full course of Algebra 1 is presented online by Georgia Virtual Learning. …
Full course of Algebra 1 is presented online by Georgia Virtual Learning. Audio, video, text, games and activities are included to engage ninth grade students in learning.
Data Management Expert Guide This guide is designed by European experts to …
Data Management Expert Guide This guide is designed by European experts to help social science researchers make their research data Findable, Accessible, Interoperable and Reusable (FAIR).
You will be guided by different European experts who are - on a daily basis - busy ensuring long-term access to valuable social science datasets, available for discovery and reuse at one of the CESSDA social science data archives.
You can download the full DMEG for your personal study offline (DOI: 10.5281/zenodo.3820473). PDFs for every single chapter are also available for being printed as handouts for training.
Discrepancies between pre-specified and reported outcomes are an important source of bias …
Discrepancies between pre-specified and reported outcomes are an important source of bias in trials. Despite legislation, guidelines and public commitments on correct reporting from journals, outcome misreporting continues to be prevalent. We aimed to document the extent of misreporting, establish whether it was possible to publish correction letters on all misreported trials as they were published, and monitor responses from editors and trialists to understand why outcome misreporting persists despite public commitments to address it. Methods We identified five high-impact journals endorsing Consolidated Standards of Reporting Trials (CONSORT) (New England Journal of Medicine, The Lancet, Journal of the American Medical Association, British Medical Journal, and Annals of Internal Medicine) and assessed all trials over a six-week period to identify every correctly and incorrectly reported outcome, comparing published reports against published protocols or registry entries, using CONSORT as the gold standard. A correction letter describing all discrepancies was submitted to the journal for all misreported trials, and detailed coding sheets were shared publicly. The proportion of letters published and delay to publication were assessed over 12 months of follow-up. Correspondence received from journals and authors was documented and themes were extracted. Results Sixty-seven trials were assessed in total. Outcome reporting was poor overall and there was wide variation between journals on pre-specified primary outcomes (mean 76% correctly reported, journal range 25–96%), secondary outcomes (mean 55%, range 31–72%), and number of undeclared additional outcomes per trial (mean 5.4, range 2.9–8.3). Fifty-eight trials had discrepancies requiring a correction letter (87%, journal range 67–100%). Twenty-three letters were published (40%) with extensive variation between journals (range 0–100%). Where letters were published, there were delays (median 99 days, range 0–257 days). Twenty-nine studies had a pre-trial protocol publicly available (43%, range 0–86%). Qualitative analysis demonstrated extensive misunderstandings among journal editors about correct outcome reporting and CONSORT. Some journals did not engage positively when provided correspondence that identified misreporting; we identified possible breaches of ethics and publishing guidelines. Conclusions All five journals were listed as endorsing CONSORT, but all exhibited extensive breaches of this guidance, and most rejected correction letters documenting shortcomings. Readers are likely to be misled by this discrepancy. We discuss the advantages of prospective methodology research sharing all data openly and pro-actively in real time as feedback on critiqued studies. This is the first empirical study of major academic journals’ willingness to publish a cohort of comparable and objective correction letters on misreported high-impact studies. Suggested improvements include changes to correspondence processes at journals, alternatives for indexed post-publication peer review, changes to CONSORT’s mechanisms for enforcement, and novel strategies for research on methods and reporting.
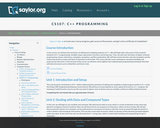
The student will learn the mechanics of editing and compiling a simple …
The student will learn the mechanics of editing and compiling a simple program written in C++ beginning with a discussion of the essential elements of C++ programming: variables, loops, expressions, functions, and string class. Next, the student will cover the basics of object-oriented programming: classes, inheritance, templates, exceptions, and file manipulation. The student will then review function and class templates and the classes that perform output and input of characters to/from files. This course will also cover the topics of namespaces, exception handling, and preprocessor directives. In the last part of the course, the student will learn some slightly more sophisticated programming techniques that deal with data structures such as linked lists and binary trees. Upon successful completion of this course, students will be able to: Compile and execute code written in C++ language; Work with the elementary data types and conditional and iteration structures; Define and use functions, pointers, arrays, struct, unions, and enumerations; Write C++ using principles of object-oriented programming; Write templates and manipulate the files; Code and use namespaces, exceptions, and preprocessor instructions; Write a code that represents linked lists and binary trees; Translate simple word problems into C++ language. (Computer Science 107)
Keynote presentations, videos, workshop materials, and other resources from the 2021 CQI …
Keynote presentations, videos, workshop materials, and other resources from the 2021 CQI Statewide Conference for Child Welfare and Probation at UC Davis
CREATES is a set of 6 steps that help learners read and …
CREATES is a set of 6 steps that help learners read and critically analyze scientific papers. The CREATES method, pioneered by Dr. Sally Hoskins, has a demonstrated positive impact on undergraduate students' self-confidence in scientific reading, as well as in their general perceptions of and beliefs about science and scientific thinking (Hoskins, et. al, 2017).
The new CREATES site, created in collaboration with Jordan Moberg Parker, UCLA's Director of Undergraduate Laboratory Curriculum and Assessment in Microbiology, Immunology, and Molecular Genetics, uses interactive media, step-by-step directions, and detailed annotation of authentic examples to guide students through the process.
Data can be used to help students understand their world and answer …
Data can be used to help students understand their world and answer interesting questions. In this lesson, students will collect data from a Play Lab project and visualize it using different kinds of graphs.
By running a simple simulation in Sprite Lab, students will experience how …
By running a simple simulation in Sprite Lab, students will experience how computing can be used to collect data that identify trends or patterns. After running the simulation multiple times, students will have an opportunity to make a prediction about how changing a variable in the simulation might impact the outcome, and then test that hypothesis.
Data Carpentry, Software Carpentry, and Library Carpentry are branches under The Carpentries …
Data Carpentry, Software Carpentry, and Library Carpentry are branches under The Carpentries known as a learning program to develop and teach workshops on the fundamental data and coding skills needed to conduct research. Participants can request to host a workshop at their institution or organization, attend a workshop, and/or involve by becoming a certified instructor, contributing in developing the content, or just simply support the programs. All lessons in either Carpentry branch can be used to teach introduction courses in data science/library information sciences.
Dashboards for data visualisation, such as R Shiny and Tableau, allow an …
Dashboards for data visualisation, such as R Shiny and Tableau, allow an interactive exploration of data by means of drop-down lists and checkboxes, with no coding for the user. The apps can be useful for both the data analyst and the public.
No restrictions on your remixing, redistributing, or making derivative works. Give credit to the author, as required.
Your remixing, redistributing, or making derivatives works comes with some restrictions, including how it is shared.
Your redistributing comes with some restrictions. Do not remix or make derivative works.
Most restrictive license type. Prohibits most uses, sharing, and any changes.
Copyrighted materials, available under Fair Use and the TEACH Act for US-based educators, or other custom arrangements. Go to the resource provider to see their individual restrictions.