Updating search results...

Search Resources

92 Results

View
Selected filters:
  • Measurement and Data
  • Lesson Plan
Igneous Rock Compositions and Plate Tectonics
Conditional Remix & Share Permitted
CC BY-NC-SA
Rating
0.0 stars

In this exercise, students are split into groups to gather whole-rock geochemical data (major-, trace-, and rare-earth elements) from the GEOROC database for igneous rocks sampled from four different plate tectonic settings: mid-ocean ridges, subduction zones, oceanic islands, and oceanic plateaus. Each group is assigned a different plate tectonic setting and collects three datasets from different locations for their tectonic setting. Geochemical data is graphed as major-element variation and REE diagrams to quantify igneous diversity both within the same tectonic setting and between different tectonic settings. The main goal of this exercise is to demonstrate that igneous rock compositions are a strong function of plate tectonic setting.

(Note: this resource was added to OER Commons as part of a batch upload of over 2,200 records. If you notice an issue with the quality of the metadata, please let us know by using the 'report' button and we will flag it for consideration.)

Subject:
Biology
Chemistry
Life Science
Mathematics
Measurement and Data
Physical Science
Statistics and Probability
Material Type:
Activity/Lab
Data Set
Lesson Plan
Provider:
Science Education Resource Center (SERC) at Carleton College
Provider Set:
Teach the Earth
Author:
Allen Glazner
Date Added:
08/18/2020
Intro to 3D Modeling w SketchUp
Conditional Remix & Share Permitted
CC BY-NC-SA
Rating
0.0 stars

Students will learn the basics of 3D modeling utilizing SketchUp Pro. Students first begin by observing the most unique building structures in the world. Then learn new skills and techniques through hands-on tutorials to learn how to create 3D models in SketchUp. Once armed with the basics, students will be tasked with creating a 3D replica of a building of their choice or one from their imagination.

Subject:
Applied Science
Architecture and Design
Career and Technical Education
Computer Science
Engineering
Geometry
Graphic Design
Mathematics
Measurement and Data
Material Type:
Activity/Lab
Assessment
Homework/Assignment
Lesson Plan
Unit of Study
Date Added:
05/12/2021
Investigating the Ocean: Exploring ecological provinces using satellite imagery and oceanographic cruise data
Conditional Remix & Share Permitted
CC BY-NC-SA
Rating
0.0 stars

Show caption
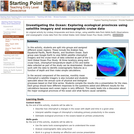
HideA screen-shot from Google Earth showing chlorophyll concentrations in the equatorial Pacific. This is the data that students use in the exercise. Details In this activity, students are split into groups and assigned different ocean regions. These include the Arabian Sea, Equatorial Pacific, North Atantic, and Southern Ocean. Each group uses Google Earth to view NASA satellite chlorophyll imagery and the cruise track of data collected as part of the U.S. Joint Global Ocean Flux Study. At three locations along each cruise track, chlorophyll-temperature-depth (CTD) and bottle data collected as part of the study can be downloaded. Students work with the data to identify oceanographic features as a function of depth and then make simple calculations.

In the second component of the exercise, monthly mean chlorophyll a satellite imagery is also included and students speculate about the annual cycle of physical and biological processes based on that time series. Students compile the results into a presentation for the class. Each group should have different responses to the questions asked and different results for the calculations because each ocean region is very different. This easily leads into a discussion about the major ecological provinces of the ocean and what factors cause variability.

(Note: this resource was added to OER Commons as part of a batch upload of over 2,200 records. If you notice an issue with the quality of the metadata, please let us know by using the 'report' button and we will flag it for consideration.)

Subject:
Biology
Geoscience
Life Science
Mathematics
Measurement and Data
Oceanography
Physical Science
Material Type:
Activity/Lab
Data Set
Lesson Plan
Provider:
Science Education Resource Center (SERC) at Carleton College
Provider Set:
Teach the Earth
Author:
Kevin Arrigo
Lindsey Kropuenske
Richa
Date Added:
06/16/2022
Long Term Ecological Resources
Conditional Remix & Share Permitted
CC BY-NC-SA
Rating
0.0 stars

Students analyze data on temperature and precipitation collected from 26 different Long Term Ecological Research sites and compare them with annual net primary productivity. The students then form an ecological rule to explain their results.

(Note: this resource was added to OER Commons as part of a batch upload of over 2,200 records. If you notice an issue with the quality of the metadata, please let us know by using the 'report' button and we will flag it for consideration.)

Subject:
Biology
Life Science
Mathematics
Measurement and Data
Material Type:
Activity/Lab
Data Set
Lesson Plan
Provider:
Science Education Resource Center (SERC) at Carleton College
Provider Set:
Teach the Earth
Author:
Scott Cooper
Date Added:
12/15/2019
Magma Modification in the central Sierra Nevada Batholith
Conditional Remix & Share Permitted
CC BY-NC-SA
Rating
0.0 stars

This exercise is centered around a suite of rocks from the Sierra Nevada batholith. The activities are designed to give petrology students a capstone experience for the igneous portion of the upper-level Petrology course. Students are given thin sections with hand samples, a map and a table of geochemical analyses (in Excel format) and asked to record hand-sample and thin section observations with the idea that these will be used to understand processes that were active during batholith generation. By the time they encounter this lab, the students have spent at least 7 lab periods looking at a variety of igneous rocks and their textures. Because students are given geochemical analyses, they are also expected to experiment with the use of graphs (e.g., Harker and spider diagrams) to better understand tables of geochemical analyses. The students use observations about rocks and geochemistry to build a coherent story around these rocks; the final product is a short paper in which they use petrographic observations and geochemical diagrams to back up their interpretations.

(Note: this resource was added to OER Commons as part of a batch upload of over 2,200 records. If you notice an issue with the quality of the metadata, please let us know by using the 'report' button and we will flag it for consideration.)

Subject:
Biology
Chemistry
Life Science
Mathematics
Measurement and Data
Physical Science
Statistics and Probability
Material Type:
Activity/Lab
Data Set
Homework/Assignment
Lesson Plan
Provider:
Science Education Resource Center (SERC) at Carleton College
Provider Set:
Teach the Earth
Author:
Jennifer Wenner
Date Added:
08/21/2019
Marine Oxygen Isotopes and Changes in Global Ice Volume
Conditional Remix & Share Permitted
CC BY-NC-SA
Rating
0.0 stars

Students explore paleoclimate of the Quaternary Period by working with marine oxygen-isotope data from Ocean Drilling Program (ODP) core 677.

(Note: this resource was added to OER Commons as part of a batch upload of over 2,200 records. If you notice an issue with the quality of the metadata, please let us know by using the 'report' button and we will flag it for consideration.)

Subject:
Applied Science
Biology
Environmental Science
Information Science
Life Science
Mathematics
Measurement and Data
Material Type:
Activity/Lab
Data Set
Lesson Plan
Provider:
Science Education Resource Center (SERC) at Carleton College
Provider Set:
Teach the Earth
Author:
Ben Laabs
Date Added:
09/27/2022
Mass Balance to Understand Atmospheric CFCs
Conditional Remix & Share Permitted
CC BY-NC-SA
Rating
0.0 stars

Students use an interactive online mass balance model help understand the observed levels of chlorofluorocarbon CFC-12 over the recent past.

(Note: this resource was added to OER Commons as part of a batch upload of over 2,200 records. If you notice an issue with the quality of the metadata, please let us know by using the 'report' button and we will flag it for consideration.)

Subject:
Atmospheric Science
Biology
Life Science
Mathematics
Measurement and Data
Physical Science
Political Science
Social Science
Statistics and Probability
Material Type:
Activity/Lab
Data Set
Lesson Plan
Provider:
Science Education Resource Center (SERC) at Carleton College
Provider Set:
Teach the Earth
Author:
Bob Mackay
Date Added:
11/04/2021
Middle School Water Quality Curriculum Synopsis
Only Sharing Permitted
CC BY-NC-ND
Rating
0.0 stars

Middle School Water Quality Curriculum SynopsisDesign your own wetland science field trip or have WREN staff visit your classroom.Programs address Oregon State Science Standards and Common Core State Learning Standards. Purpose of the Water Quality Curriculum: •    For students to model the scientific method, engineering, math, and social studies practices. •    To explore and solve problems along the Long Tom River Watershed. •    To use tools and technology to collect data and use that data to answer questions.•    To engineer solutions to real-life problems and learn how to resolve water quality disputes in real-life scenarios.  Each lesson can be integrated into our 2-hour tour of the West Eugene Wetlands (WEW). How much time is required for the lesson, the best season, and where the lesson is best experienced is indicated next to the lesson tile._______________________________________________________________________________________________What is a Watershed? Activity/ 50 minutes (Class or WEW):It’s recommended that all classes begin their wetland field study with this fun and interactive, whole-body activity that investigates how vegetation affects the movement of water over land surfaces and identifies best management practices to reduce erosion. Science Standards: MS-ESS2; MS-ESS2-4.    Earth’s Systems: Develop a model to describe cycling of water through earth’s systems driven by energy from the sun and force of gravity._______________________________________________________________________________________________Wetland Soil Study/ 90 minutes (WEW- Fall or Spring):Students will learn the history behind the unique composition of soil in the southern Willamette Valley, discover how wetland soils have an important role in filtering and cleaning the water that runs through them, explore and record the physical characteristics of wetland soil using a Munsell Chart, measure the hydric capacity of different types of soil, and make the connection between soils and water in a wet prairie. Science Standards: MS-ESS2-2.    Earth’s Systems: Construct an explanation based on evidence for how geoscience processes have changed Earth's surface at varying time and spatial scales.Common Core Standards:Mathematics7.EE.B.4.     Use variables to represent quantities in a real-world of mathematical problem, and construct simple equations and inequalities to solve problems by reasoning about quantities.______________________________________________________________________________________________           Water Quality of Amazon Creek/ 90 minutes (WEW- Fall and Spring):Through experimentation and a simulation, students will learn how increases in water acidity have endangered the quality of life for water-based organisms in parts of Eugene. Students will model water molecules under different circumstances, test water samples from Amazon creek for dissolved oxygen, PH, and temperature and learn how these variables impact the quality of life in our waterways.  Science Standards: MS-PS1-1.          Matter and Its Interactions: Develop models to describe the atomic composition of simple molecules  and extended structures.Common Core Standards:Mathematics 6.SP.B.4.            Display numerical data in plots on a number line, including dot plots, histograms, and box plots.7.EE.3.               Solve multiple real-life & mathematical problems posed with positive and negative rational numbers in any form using tools strategically. Apply properties of operations to calculate with numbers in any form. _______________________________________________________________________________________________Flood-Plan Engineering Design/ 90 minutes (WEW or Class- Fall, Winter, Spring):Students will learn about historic floods in the Willamette Valley, and explore flood dynamics by building models of riverbeds and testing their holding capacity. Students will use engineering to design systems that will help prevent flood damage and learn about how human modifications to a river or wetland can alter the floodplain.Science Standards:MS-ESS3-3.     Earth’s & Human Activity: Apply Scientific principles to design a method for monitoring and minimizing a human impact on the environment.MS-ESS3-2.    Earth’s & Human Activity: Analyze and interpret data on natural hazards to forecast future catastrophic events and inform the development of technologies to mitigate their efforts.MS-ETS1-1; 1-4. Engineering Design: Develop a model to generate data for iterative testing and modification of a  proposed object, tool, or process such that an optimal design can be achieved.  Common Core Standards:MathematicsMP.2.        Reason abstractly and quantitatively._______________________________________________________________________________________________Water Quality Debate/ 60 minutes (Class- Fall, Winter, Spring):Students will demonstrate how disputes regarding water quality and quantity can be settled through mediation by playing character roles in a mock Town Hall Meeting. They will develop and engage in an evidence supporting argument surrounding a local water-related issue, evaluate arguments presented by others of different viewpoints, and decide on a resolution.Science Standards:MS-LS2-5.    Ecosystems: Interactions, Energy and Dynamics: Evaluate competing design solutions for maintaining biodiversity and ecosystem servicesCommon Core Standards:ELA/LiteracyMS-LS-2-2.    Engage effectively in a range of collaborative discussions (one on one, in groups, and teacher led) with diverse partners on grade 8 topics, texts, and issues, building on other’s ideas and expressing their own clearly. MS-LS2-2.    Present claims or findings, emphasizing salient points in a focused coherent manner with relevant evidence, sound valid reasoning and adequate well-chosen details, use appropriate eye contact, adequate volume, and other pronunciation. 
Subject:
Computer Science
Ecology
Engineering
Environmental Science
Environmental Studies
Measurement and Data
Ratios and Proportions
Sociology
Speaking and Listening
Material Type:
Lesson Plan
Author:
Laura Maloney
Date Added:
08/03/2018
Modeling: Rolling Cups
Only Sharing Permitted
CC BY-NC-ND
Rating
0.0 stars

This lesson unit is intended to help teachers assess how well students are able to: choose appropriate mathematics to solve a non-routine problem; generate useful data by systematically controlling variables; and develop experimental and analytical models of a physical situation.

Subject:
Functions
Geometry
Mathematics
Measurement and Data
Material Type:
Assessment
Lesson Plan
Provider:
Shell Center for Mathematical Education
Provider Set:
Mathematics Assessment Project (MAP)
Date Added:
04/26/2013
My Special Place
Conditional Remix & Share Permitted
CC BY-NC-SA
Rating
0.0 stars

Students pick a place of significance to them (their Special Place) for analysis in this semester-long project. (A model is provided by the instructor using a place the students are not likely to have visited.)

(Note: this resource was added to OER Commons as part of a batch upload of over 2,200 records. If you notice an issue with the quality of the metadata, please let us know by using the 'report' button and we will flag it for consideration.)

Subject:
Biology
Geoscience
Life Science
Mathematics
Measurement and Data
Physical Science
Statistics and Probability
Material Type:
Lesson Plan
Provider:
Science Education Resource Center (SERC) at Carleton College
Provider Set:
Teach the Earth
Author:
Sadredin Moosavi
Date Added:
09/11/2020
Módulo de matemáticas 1 de grado 5
Conditional Remix & Share Permitted
CC BY-NC-SA
Rating
0.0 stars

(Nota: Esta es una traducción de un recurso educativo abierto creado por el Departamento de Educación del Estado de Nueva York (NYSED) como parte del proyecto "EngageNY" en 2013. Aunque el recurso real fue traducido por personas, la siguiente descripción se tradujo del inglés original usando Google Translate para ayudar a los usuarios potenciales a decidir si se adapta a sus necesidades y puede contener errores gramaticales o lingüísticos. La descripción original en inglés también se proporciona a continuación.)

En el módulo 1, la comprensión de los estudiantes de los patrones en el sistema Base Ten se extiende desde el trabajo de Grado 4 con el valor de lugar de números enteros y decimales de varios dígitos a centésimas hasta el lugar de milésimas. En el grado 5, los estudiantes profundizan su conocimiento a través de una comprensión más generalizada de las relaciones entre y entre los lugares adyacentes en la tabla de valor del lugar, por ejemplo, 1 décimo veces cualquier dígito en la tabla de valor del lugar lo mueve un valor de un lugar a la derecha. Hacia el final del módulo, los estudiantes aplican estos nuevos entendimientos, ya que razonan y realizan operaciones decimales a través del lugar de las centésimas.

Encuentre el resto de los recursos matemáticos de Engageny en https://archive.org/details/engageny-mathematics.

English Description:
In Module 1, students’ understanding of the patterns in the base ten system are extended from Grade 4’s work with place value of multi-digit whole numbers and decimals to hundredths to the thousandths place. In Grade 5, students deepen their knowledge through a more generalized understanding of the relationships between and among adjacent places on the place value chart, e.g., 1 tenth times any digit on the place value chart moves it one place value to the right. Toward the module’s end students apply these new understandings as they reason about and perform decimal operations through the hundredths place.

Find the rest of the EngageNY Mathematics resources at https://archive.org/details/engageny-mathematics.

Subject:
Mathematics
Measurement and Data
Material Type:
Activity/Lab
Assessment
Lesson Plan
Provider:
New York State Education Department
Provider Set:
EngageNY
Date Added:
06/28/2023
North Cascades Institute Snow Crystal Morphology Lesson
Conditional Remix & Share Permitted
CC BY-SA
Rating
0.0 stars

Lesson plan to explore how snow crystals form, atmospheric conditions that influence crystal morphology. Makes connections crystals, snow density and water content

Subject:
Applied Science
Career and Technical Education
Environmental Science
Environmental Studies
Mathematics
Measurement and Data
Material Type:
Activity/Lab
Game
Lesson Plan
Date Added:
05/23/2019
Optimization Problems: Boomerangs
Only Sharing Permitted
CC BY-NC-ND
Rating
0.0 stars

This lesson unit is intended to help teachers assess how well students are able to: interpret a situation and represent the constraints and variables mathematically; select appropriate mathematical methods to use; explore the effects of systematically varying the constraints; interpret and evaluate the data generated and identify the optimum case, checking it for confirmation; and communicate their reasoning clearly.

Subject:
Mathematics
Measurement and Data
Material Type:
Assessment
Lesson Plan
Provider:
Shell Center for Mathematical Education
Provider Set:
Mathematics Assessment Project (MAP)
Date Added:
04/26/2013
Order/Disorder Within Crystal Structures as a Function of Temperature
Conditional Remix & Share Permitted
CC BY-NC-SA
Rating
0.0 stars

This exercise is based on recent crystallographic research on the olivine crystal structure published by Redfern et al. (2000). The authors of this study synthesized Fa50 olivine olivine (MgFeSiO4) in an experimental apparatus at temperatures ranging from 100 to 1250 °C, quenched the experiments, and used in situ neutron powder diffraction techniques to investigate changes in the synthesized olivines as a function of temperature. While this study reports cutting-edge materials research carried out with the latest crystallographic techniques, the results are educationally instructive and illustrate important concepts normally covered in an undergraduate mineralogy course.

In this exercise, students are guided into the American Mineralogist Crystal Structure Database to retrieve and download published crystal structure data for viewing in either the CrystalMaker or XtalDraw visualization software packages. The students are instructed on how to manipulate the structures and are asked to plot some of the crystallographic data from this study on graphs using a spreadsheet program such as Excel.

(Note: this resource was added to OER Commons as part of a batch upload of over 2,200 records. If you notice an issue with the quality of the metadata, please let us know by using the 'report' button and we will flag it for consideration.)

Subject:
Chemistry
Geoscience
Mathematics
Measurement and Data
Physical Science
Statistics and Probability
Material Type:
Activity/Lab
Data Set
Diagram/Illustration
Interactive
Lesson Plan
Provider:
Science Education Resource Center (SERC) at Carleton College
Provider Set:
Teach the Earth
Author:
Kent Ratajeski
Date Added:
08/08/2019
Petrography and Petrogenesis of a Mid-Ocean Ridge Lava Suite
Conditional Remix & Share Permitted
CC BY-NC-SA
Rating
0.0 stars

This is a laboratory-style investigation wherein students examine the petrography and major-element geochemistry of 6 samples of mid-ocean ridge basalt and related differentiated lavas recovered from the Cleft segment of southern Juan de Fuca Ridge, a medium spreading-rate MOR in the northeast Pacific Ocean. Lava types range from basalt to dacite.

After some initial background information on basalts, the MOR environment, and the study area students investigate four thin sections, beginning with typical basalts and ending with a dacite. They are led through a series of directed questions that help them gain familiarity with commonly occurring minerals and textures in mid-ocean ridge lavas. Questions direct students toward the interpretation of quench-related textural features and crystallization sequence, as well as a few other textural observations and petrographic techniques. After proceeding through the initial four thin sections and associated questions student are then asked to undertake "full thin-section descriptions" of the remaining two samples.Â

After investigating the thin-sections and determining a possible crystallization sequence from the petrographic data gathered (plagioclase followed by olivine followed by augitic clinopyroxene followed by pigeonite), students examine a P-T phase diagram to constrain possible pressures of formation. Discovering that crystallization pressures were low (less than ~ 0.75 GPa) students then examine a phase diagram of the olivine-plagioclase-augite-quartz system (olivine-quartz-augite ternary, projected from the plane of plagioclase saturation) [Walker, 1979]. Students draw 2 possible liquid lines of descent (LLD) onto the diagram, and then use their petrographic observations to qualitatively plot the samples along that LLD, determining a relative sequence of chemical evolution for the suite of samples. Lastly, given those determinations, student graph the major element data for the lava suite to infer paths of chemical evolution and the effects of fractional crystallization (possibly coupled with magma mixing).

(Note: this resource was added to OER Commons as part of a batch upload of over 2,200 records. If you notice an issue with the quality of the metadata, please let us know by using the 'report' button and we will flag it for consideration.)

Subject:
Biology
Chemistry
Life Science
Mathematics
Measurement and Data
Physical Science
Physics
Statistics and Probability
Material Type:
Activity/Lab
Data Set
Diagram/Illustration
Lesson Plan
Provider:
Science Education Resource Center (SERC) at Carleton College
Provider Set:
Teach the Earth
Author:
Matthew Smith
Mike Perfit
Date Added:
11/03/2020
Popcorn Physics
Conditional Remix & Share Permitted
CC BY-NC-SA
Rating
0.0 stars

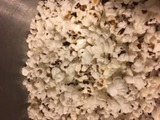
Popcorn pops due to the moisture in the kernel that explodes when heated.  In this lesson students will compare kernels soaked in water before popping with dry kernels to see whether it makes a difference in the number of unpopped kernels. 

Subject:
Measurement and Data
Physical Science
Material Type:
Lesson Plan
Author:
Melissa Thiel-Stinson
Date Added:
02/15/2019
Problem set: Constructing metamorphic phase diagrams using phase equilibria and the Clausius-Clapeyron equation
Conditional Remix & Share Permitted
CC BY-NC-SA
Rating
0.0 stars

In this problem set students construct a P-T phase diagram for the aluminosilicate polymorphs based on experimental phase equilibria and application of the Clausius-Clapeyron equation. The problem set uses unit cell volume, molar entropy, and phase equilibrium data culled from the primary literature. It leads students through the exercise in step-by-step fashion starting with a brief explanation of the Clausius-Clapeyron equation. The main goals are to help students understand how thermodynamics can be useful for solving real geologic problems, to provide some insights into the nature and construction of P-T phase diagrams, and to provide experience in dealing quantitatively with real data.

(Note: this resource was added to OER Commons as part of a batch upload of over 2,200 records. If you notice an issue with the quality of the metadata, please let us know by using the 'report' button and we will flag it for consideration.)

Subject:
Biology
Life Science
Mathematics
Measurement and Data
Physical Science
Physics
Statistics and Probability
Material Type:
Activity/Lab
Data Set
Lesson Plan
Provider:
Science Education Resource Center (SERC) at Carleton College
Provider Set:
Teach the Earth
Date Added:
09/06/2020