Students will be using real-life energy use data to learn how to …
Students will be using real-life energy use data to learn how to use spreadsheets and create graphs to better organize and view data. Discussions can then follow to analyze the data and explain the usage. Real rates are then provided, and students can use the electricity consumed data to create a utility bill for the consumer and compare the standard Residential Service charges to if the member were instead billed by the “Time of Use” rate.
I use an "engaging question" on the first day of class in …
I use an "engaging question" on the first day of class in all of my courses. This activity is designed to be both engaging and central to all of the course content. That is, the activity is designed around questions that we can keep coming back to, over and over, after each learning unit. This approach not only provides a unifying focus for the course, but it also provides an opportunity to model critical thinking as we revisit the question each time with a different perspective. For the Dynamic Earth and Global Change (the Physical Geology course at Macalester) I chose a question about climate change. The activity starts with two graphs (plots of surface temperature and atmosphere CO2 composition for the past 1,000 years). Students are asked to describe the graphs, interpret the graphs, make some predictions, and explain the graphs using basic earth science processes.
(Note: this resource was added to OER Commons as part of a batch upload of over 2,200 records. If you notice an issue with the quality of the metadata, please let us know by using the 'report' button and we will flag it for consideration.)
An activity designed to enable the students to access the impact of …
An activity designed to enable the students to access the impact of oil-development on environment in Alaska. Students will draw conclusion based on various data and reading various views.
(Note: this resource was added to OER Commons as part of a batch upload of over 2,200 records. If you notice an issue with the quality of the metadata, please let us know by using the 'report' button and we will flag it for consideration.)
This lesson unit is intended to help you assess how well students …
This lesson unit is intended to help you assess how well students are able to: solve simple problems involving ratio and direct proportion; choose an appropriate sampling method; and collect discrete data and record them using a frequency table.
In this computer lab, students use satellite imagery, daylength information, and phytoplankton …
In this computer lab, students use satellite imagery, daylength information, and phytoplankton physiology models to calculate annual primary production for an assigned ocean region.
Satellite data is obtained from the NASA Earth Observation website. Students use the analysis tool to determine chlorophyll concentration and sea surface temperature. They also receive a day-length calculator and are asked to model light transmission through the water column. Using step-by-step instructions and proviede equations relating phytoplankton physiology to irradiance and temperature students calculate carbon uptake at discreet locations in the water column. The second half of the exercise involves scaling up to the entire water column, region, and season. Students present their work to the class and evaluate their result using scientific literature. Differences between regions are then discussed by the class.
(Note: this resource was added to OER Commons as part of a batch upload of over 2,200 records. If you notice an issue with the quality of the metadata, please let us know by using the 'report' button and we will flag it for consideration.)
This module introduces students to the fundamental principles and uses of electrical …
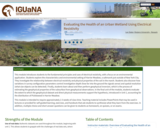
This module introduces students to the fundamental principles and uses of electrical resistivity, with a focus on an environmental application. Students explore the characteristics and environmental setting of Harrier Meadow, a saltmarsh just outside of New York City. They investigate the relationship between electrical resistivity and physical properties of the soil in the marsh. Students also discover how variations in survey configuration parameters control investigation depth (how far into the ground the signals sense) and spatial resolution (what size objects can be detected). Finally, students learn about and then perform geophysical inversion, which is the process of estimating the geophysical properties of the subsurface from geophysical observations. In the final unit of the module, students evaluate the extent to which the geophysical dataset and direct physical measurements support the hypothesis, introduced in Unit 1, accounting for the distribution of Pickleweed in Harrier Meadow. This module is intended to require approximately 2-3 weeks of class time. Teaching material includes PowerPoints that may be used in lectures or provided for self-guided learning, exercises, and handouts that ask students to synthesize what they learn from the exercises. In addition, multiple choice and short answer questions can be given to students as homework, on quizzes, or on exams.
(Note: this resource was added to OER Commons as part of a batch upload of over 2,200 records. If you notice an issue with the quality of the metadata, please let us know by using the 'report' button and we will flag it for consideration.)
Aims:to integrate formal and non-formal learning through different subjects (math, science, literacy, …
Aims:to integrate formal and non-formal learning through different subjects (math, science, literacy, art, handicraft, English,music), promoting the use of ICT, integrating students theoretical skills with practical ones, achieving better results in basic subjects, developing the skills of teamwork
Aims:to integrate formal and non-formal learning through different subjects (math, science, literacy, …
Aims:to integrate formal and non-formal learning through different subjects (math, science, literacy, art, handicraft, English)promoting the use of ICTintegrating students` theoretical skills with practical onesachieving better results in basic subjectsdeveloping the skills of teamwork
The purpose of the exercise is to familiarize igneous petrology students with …
The purpose of the exercise is to familiarize igneous petrology students with flow properties of lava, especially viscosity, and to have them consider effects on viscosity due to temperature, crystallinity and volatile content. The problem uses data from an actual eruption.
(Note: this resource was added to OER Commons as part of a batch upload of over 2,200 records. If you notice an issue with the quality of the metadata, please let us know by using the 'report' button and we will flag it for consideration.)
This lesson unit is intended to help teachers assess how well students …
This lesson unit is intended to help teachers assess how well students are able to identify linear and quadratic relationships in a realistic context: the number of tiles of different types that are needed for a range of square tabletops. In particular, this unit aims to identify and help students who have difficulties with: choosing an appropriate, systematic way to collect and organize data; examining the data and looking for patterns; finding invariance and covariance in the numbers of different types of tile; generalizing using numerical, geometrical or algebraic structure; and describing and explaining findings clearly and effectively.
This lesson unit is intended to help you assess how well students …
This lesson unit is intended to help you assess how well students working with square numbers are able to: choose an appropriate, systematic way to collect and organize data, examining the data for patterns; describe and explain findings clearly and effectively; generalize using numerical, geometrical, graphical and/or algebraic structure; and explain why certain results are possible/impossible, moving towards a proof.
In this problem set the students use two different equations to calculate …
In this problem set the students use two different equations to calculate a conductive geothermal gradient using a spreadsheet program like Excel. Once they have the geothermal gradient plotted, they are asked to experiment with and comment on the model by changing parameters (e.g. mantle heat flow, thermal conductivity). There is a mix of specific, fill in the blank questions and open-ended questions. This problem set helps develop quantitative problem solving skills using a spreadsheet as a tool, and forces students to think about thermal constraints during igneous and metamorphic processes.
(Note: this resource was added to OER Commons as part of a batch upload of over 2,200 records. If you notice an issue with the quality of the metadata, please let us know by using the 'report' button and we will flag it for consideration.)
In this activity students practice measuring techniques by measuring different objects and …
In this activity students practice measuring techniques by measuring different objects and distances around the classroom. They practice using different scales of measurement in metric units and estimation.
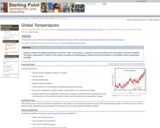
Students analyze the global temperature record from 1867 to the present. Long-term …
Students analyze the global temperature record from 1867 to the present. Long-term trends and shorter-term fluctuations are both evaluated.
(Note: this resource was added to OER Commons as part of a batch upload of over 2,200 records. If you notice an issue with the quality of the metadata, please let us know by using the 'report' button and we will flag it for consideration.)
In Module 1, students’ understanding of the patterns in the base ten …
In Module 1, students’ understanding of the patterns in the base ten system are extended from Grade 4’s work with place value of multi-digit whole numbers and decimals to hundredths to the thousandths place. In Grade 5, students deepen their knowledge through a more generalized understanding of the relationships between and among adjacent places on the place value chart, e.g., 1 tenth times any digit on the place value chart moves it one place value to the right. Toward the module’s end students apply these new understandings as they reason about and perform decimal operations through the hundredths place.
Find the rest of the EngageNY Mathematics resources at https://archive.org/details/engageny-mathematics.
The is a curriculum module from the project Data Sets and Inquiry …
The is a curriculum module from the project Data Sets and Inquiry in Geoscience Education (DIGS). The module consists of a week-long unit and two-day performance assessment in which students apply the inquiry skills to problem-based investigations of urban micro-climates. The unit and performance assessment present semi-parallel tasks but about different cities (Phoenix and Chicago).
Sudents draw conclusions about the extent to which multiple decades of temperature data about Phoenix suggest that a shift in local climate is taking place as opposed to exhibiting nothing more than natural variability. The data are from the Global Climate Historical Network (GHCN) database. GHCN is a large, multi-year, international project to measure temperature, precipitation, and air pressure from near the ground. Each monthly maximum and minimum temperature is the highest and lowest temperature reading for the month, measured in Celsius. In Phoenix and in most other places, the temperature data are collected at local airports. The performance assessment for this module requires that students apply the methods and findings from the investigation of the climate data for Phoenix to climate data for Chicago. The Chicago data shows less evidence of trends in temperature change, and this is most evident comparing the night-time minimum temperature fluctuations between the two cities. Chicago also exhibits less increase in urban development and population growth than does Phoenix. In contrast to the curriculum unit, which primarily uses constructed-response tasks to encourage student explanation and discussion, the climate assessment tasks pose explicit selected- and constructed-response questions to ensure that the items elicit the intended thinking and hence provide evidence of the targeted standards-aligned skills and understandings.
(Note: this resource was added to OER Commons as part of a batch upload of over 2,200 records. If you notice an issue with the quality of the metadata, please let us know by using the 'report' button and we will flag it for consideration.)
This homework has two parts. In the first part, the students use …
This homework has two parts. In the first part, the students use Stoke's Law to determine (a) the relative sizes of olivine and plagioclase settling at the same velocity (and relate their answer to observations made on cumulate rocks in the lab, (b) the length of time it would take a xenolith-bearing basalt on Hawaii to reach the surface, and (c) to realize that pumice landing on seawater will float, not sink! In part 2, the students fill out a worksheet to see the effects of simultaneous fractional crystallization of olivine, clinopyroxene, and plagioclase on residual melt composition, and then determine whether the melt follows a tholeiitic or calcalkaline trend. The homework involves simple algebra, but several unit conversions and normalization of the results. After the students hand in the homework, we have a class discussion on the assumptions and problems associated with using Stoke's Law to model magmatic processes. We also work with different colored marbles to see the effects of fractional removal of different "minerals" on residual magma composition. My main goal in assigning this homework is to have students see that they can use simple math to come up with results for themselves, and then to have them think about the significance of those results.
(Note: this resource was added to OER Commons as part of a batch upload of over 2,200 records. If you notice an issue with the quality of the metadata, please let us know by using the 'report' button and we will flag it for consideration.)
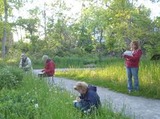
Kindergartners measure each other's height using large building blocks, then visit a …
Kindergartners measure each other's height using large building blocks, then visit a 2nd and a 4th grade class to measure those students. They can also measure adults in the school community. Results are displayed in age-appropriate bar graphs (paper cut-outs of miniature building blocks glued on paper to form a bar graph) comparing the different age groups. The activities that comprise this lesson help students develop the concepts and vocabulary to describe, in a non-ambiguous way, how height changes as children get older. The introduction to graphing provides an important foundation for both creating and interpreting graphs in future years.
The transgressive coastal sequence, as a fundamental concept in stratigraphy, will be …
The transgressive coastal sequence, as a fundamental concept in stratigraphy, will be explored by the students in a hands-on activity based on a set of high-resolution seismic profiles collected in the shoreface off Assateague Island, Maryland and Virginia. Small groups of 2-3 students will identify primary surfaces, such as the ravinement surface and sequence boundaries, and major sedimentary facies, such as offshore shoals, flood-tidal deltas, and tidal inlets, in a set of shore-parallel and shore-perpendicular lines. The exercise begins with factors controlling relative sea level and leads into accommodation space and preservation potential.
(Note: this resource was added to OER Commons as part of a batch upload of over 2,200 records. If you notice an issue with the quality of the metadata, please let us know by using the 'report' button and we will flag it for consideration.)
In this exercise, students use whole-rock major- and trace-element compositions of igneous …
In this exercise, students use whole-rock major- and trace-element compositions of igneous rocks from a variety of tectonic settings and locations to explore the importance of plate setting in determining magma compositions. Students are split into groups and assigned different tectonic settings to examine and compare with other groups. Datasets are obtained from the GEOROC database, imported into Excel spreadsheets, and graphed to learn how igneous rock compositions are a function of plate tectonic setting.
(Note: this resource was added to OER Commons as part of a batch upload of over 2,200 records. If you notice an issue with the quality of the metadata, please let us know by using the 'report' button and we will flag it for consideration.)
No restrictions on your remixing, redistributing, or making derivative works. Give credit to the author, as required.
Your remixing, redistributing, or making derivatives works comes with some restrictions, including how it is shared.
Your redistributing comes with some restrictions. Do not remix or make derivative works.
Most restrictive license type. Prohibits most uses, sharing, and any changes.
Copyrighted materials, available under Fair Use and the TEACH Act for US-based educators, or other custom arrangements. Go to the resource provider to see their individual restrictions.