Several new content pieces invite you to do hands-on work with web …
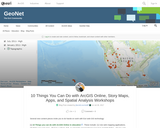
Several new content pieces invite you to do hands-on work with web GIS technology:
[1] 10 Things you can do with ArcGIS Online in education. These include: (1) Use web mapping applications. (2) Make your own map. (3) Get a school, club, or university organizational account in ArcGIS Online. (4) Use and modify existing curricular resources. (5) Explore the Living Atlas of the World. (6) Modify and ask questions of maps. (7) Conduct spatial analysis on mapped data. (8) Add multimedia to maps. (9) Explore your world in 3D, and (10) Map and analyze field-collected data.
[2] Introduction and Advanced Work with Story Maps: Slides and hands-on exercises. These include how to build a story map from a web map, and how to build map tours, map journals, swipe, series, and other types of story maps.
[3] Teaching with Web Apps. Set of resources and activities. These include examining Pacific typhoons in 3D, demographics of Zip Codes, creating viewsheds and buffers, and much more.
[4] Spatial Analysis in Human Geography. These include the 1854 cholera epidemic in London (activity), a Boulder County hazards analysis (map), and an examination of the Human Development Index around the world (map).
I created this content for the Esri mapping lab for the 2017 National Conference on Geography Education, but it can also be used to support your own professional development or for your own instruction.
This studio explores the notion of in-between by engaging several relationships; the …
This studio explores the notion of in-between by engaging several relationships; the relationship between intervention and perception, between representation and notation and between the fixed and the temporal. In the Exactitude in Science, Jorge Luis Borges tells the perverse tale of the one to one scale map, where the desire for precision and power leads to the escalating production of larger and more accurate maps of the territory. For Jean Baudrillard, "The territory no longer precedes the map nor survives it. …it is the map that precedes the territory... and thus, it would be the territory whose shreds are slowly rotting across the map." The map or the territory, left to ruin-shredding across the 'other', beautifully captures the tension between reality and representation. Mediating between collective desire and territorial surface, maps filter, create, frame, scale, orient, and project. A map has agency. It is not merely representational but operational, the experience and discursive potential of this process lies in the reciprocity between the representation and the real. It is in-between these specific sets of relationships that this studio positions itself.
Birds are everywhere. Have you ever stopped to consider what your neighborhood …
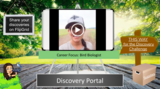
Birds are everywhere. Have you ever stopped to consider what your neighborhood birds need to survive and what their habitat is? Check out the Bird Biologist video to learn how the Wallowa-Whitman National Forest is studying white headed woodpeckers. In the Discovery Challenge video, you will go outside and map the sounds you hear. Then, design, build, and set out a bird feeder to explore the habitat needs of your neighborhood birds.
This lesson introduces NGSS standards, and those standards are listed in the lesson and is part of the Explore Science Club series, an online Career Connected Learning program developed by the Greater Oregon STEM Hub. To learn more find us at: www.go-stem.org.
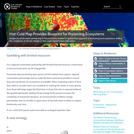
To manage their businesses successfully, farmers and food production companies need to …
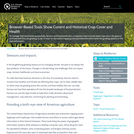
To manage their businesses successfully, farmers and food production companies need to know what crops are in the ground and how well they are growing. A pair of easy-to-use online mapping tools provides this information for growing seasons in the past and present.
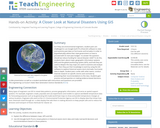
As if they are environmental engineers, student pairs are challenged to use …
As if they are environmental engineers, student pairs are challenged to use Google Earth Pro (free) GIS software to view and examine past data on hurricanes and tornados in order to (hypothetically) advise their state government on how to proceed with its next-year budget—to answer the question: should we reduce funding for natural disaster relief? To do this, students learn about maps, geographic information systems (GIS) and the global positioning system (GPS), and how they are used to deepen the way maps are used to examine and analyze data. Then they put their knowledge to work by using the GIS software to explore historical severe storm (tornado, hurricane) data in depth. Student pairs confer with other teams, conduct Internet research on specific storms and conclude by presenting their recommendations to the class. Students gain practice and perspective on making evidence-based decisions. A slide presentation as well as a student worksheet with instructions and questions are provided.
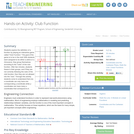
Students explore the definition of a function by playing an interactive game …
Students explore the definition of a function by playing an interactive game called "Club Function." The goal of the game is to be in the club! With students each assigned to be either a zebra or a rhinoceros, they group themselves according to the "rules" of the club function. After two minutes, students freeze in their groups, and if they are not correctly following the rules of the club function, then they are not allowed into the "club." Through this activity students come to understand that one x-coordinate can only have one corresponding y-coordinate while y-coordinates can have many x-coordinates that correspond to it.
In this module you will get to know your teens, your neighborhood, …
In this module you will get to know your teens, your neighborhood, and the community assets that can help you create connected learning experiences in your library.
Associated "Topic Development with Concept Mapping Lesson" plan and handouts are also …
Associated "Topic Development with Concept Mapping Lesson" plan and handouts are also available for download and adaptation in the Guttman Community College OER collection in CUNY Academic Works.
This course explores visualization methodologies to conceive and represent systems and data, …
This course explores visualization methodologies to conceive and represent systems and data, e.g., financial, media, economic, political, etc., with a particular focus on climate change data in this version of the course. Topics include basic methods for research, cleaning, and analysis of datasets, and creative methods of data presentation and storytelling. The course considers the emotional, aesthetic, ethical, and practical effects of different presentation methods as well as how to develop metrics for assessing impact. Coursework includes readings, visualization exercises, and a final project.
This is not a typical e-book; it is a free, web-based, open-source …
This is not a typical e-book; it is a free, web-based, open-source “textbook” available to anyone interested in using mapping tools to create maps. This e-text focuses primarily on Geographic Information Systems (GIS)—a geospatial technology that enables you to create spatial databases, analyze spatial patterns, and produce maps that communicate more effectively. While this GIS textbook is principally an introduction to GIS, most of the chapter’s concepts are applicable to other geotechnologies including remote sensing, global positioning systems (GPS), Internet mapping, and virtual globes.
Creating good maps and analyzing spatial data is a time consuming and challenging practice, but recently, a new set of powerful mapping tools has enabled almost anyone with a computer to make maps easily and to perform at least some low-level analyses. The results, however, are not encouraging. Most of the new mapmakers do not have adequate training in mapping concepts and spatial analysis principles, and their maps are often improperly designed and do not communicate easily nor effectively. This e-text—GIS Commons—seeks to help you analyze spatial data and communicate more effectively. In short, GIS education is our goal.
This class is designed to expose you to the cycles of disasters, …
This class is designed to expose you to the cycles of disasters, the roots of emergency planning in the U.S., how to understand and map vulnerabilities, and expose you to the disaster planning in different contexts, including in developing countries.
Students use graph theory to create social graphs for their own social …
Students use graph theory to create social graphs for their own social networks and apply what learn to create a graph representing the social dynamics found in a dramatic text. Students then derive meaning based on what they know about the text from the graphs they created. Students learn graph theory vocabulary, as well as engineering applications of graph theory.
Students analyze their social networks using graph theory. They gather data on …
Students analyze their social networks using graph theory. They gather data on their own social relationships, either from Facebook interactions or the interactions they have throughout the course of a day, recording it in Microsoft Excel and using Cytoscape (a free, downloadable application) to generate social network graphs that visually illustrate the key persons (nodes) and connections between them (edges). The nodes in the Cytoscape graphs are color-coded and sized according to the importance of the node (in this activity, nodes are people in students' social networks). After the analysis, the graphs are further examined to see what can be learned from the visual representation. Students gain practice with graph theory vocabulary, including node, edge, betweeness centrality and degree on interaction, and learn about a range of engineering applications of graph theory.
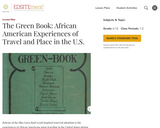
Release of the film Green Book (2018) inspired renewed interest in the …
Release of the film Green Book (2018) inspired renewed interest in the experiences of African Americans when traveling in the United States during the 20th century. This inquiry-based lesson combines individual investigations with whole or small group analysis of primary sources and visual media to investigate the compelling question: How have the intersections of race and place impacted U.S. history and culture?
The marine environment is unique and requires technologies that can use sound …
The marine environment is unique and requires technologies that can use sound to gather information since there is little light underwater. The sea-floor is characterized using underwater sound and acoustical systems. Current technological innovations are allowing scientists to further understand and apply information about animal locations and habitat. Remote sensing and exploration with underwater vehicles allows scientists to map and understand the sea floor, and in some cases, the water column. In this lesson, the students will be shown benthic habitat images produced by GIS. These imaged will lead to a class discussion on why habitat mapping is useful and how current technology works to make bathymetry mapping possible. The teacher will then ask inquiry-based questions to have students brainstorm about the importance of bathymetry mapping.
A regional conservation partnership in Massachusetts needed to update their approach to …
A regional conservation partnership in Massachusetts needed to update their approach to evaluating land acquisitions. Adding the complexity of climate change to their map helped resolve their vision.
Map of Africa coded by the number of underweight children per square …
Map of Africa coded by the number of underweight children per square kilometer. It is thus a measure of the absolute density of hungry individuals, a combination of hunger and population density.
Map of Asia color coded by infant mortality rate broken down by …
Map of Asia color coded by infant mortality rate broken down by nation or subnational units (akin to US states or Canadian provinces). Shows the international differences, but also shows the (less substantial) differences within nations. The categories for the color coding have been changed slightly from the international standards to better fit the situation in Asia.
Map of Europe color coded by infant mortality rate broken down by …
Map of Europe color coded by infant mortality rate broken down by nation or subnational units (akin to US states or Canadian provinces). Shows the international differences, but also shows the (less substantial) differences within nations. The categories for the color coding have been changed from the international standards to differentiate among the universally low infant mortality rates across Europe.
No restrictions on your remixing, redistributing, or making derivative works. Give credit to the author, as required.
Your remixing, redistributing, or making derivatives works comes with some restrictions, including how it is shared.
Your redistributing comes with some restrictions. Do not remix or make derivative works.
Most restrictive license type. Prohibits most uses, sharing, and any changes.
Copyrighted materials, available under Fair Use and the TEACH Act for US-based educators, or other custom arrangements. Go to the resource provider to see their individual restrictions.