Introductory survey of quantitative methods (QM), or the application of statistics in …
Introductory survey of quantitative methods (QM), or the application of statistics in the workplace. Examines techniques for gathering, analyzing, and interpreting data in any number of fieldsĺÎĺ from anthropology to hedge fund management.
This resource is a video abstract of a research paper created by …
This resource is a video abstract of a research paper created by Research Square on behalf of its authors. It provides a synopsis that's easy to understand, and can be used to introduce the topics it covers to students, researchers, and the general public. The video's transcript is also provided in full, with a portion provided below for preview:
"Gastrointestinal stromal tumors (GISTs) are the most common malignant tumors in a type of gut tissue called mesenchyme. They’re caused by mutations that activate receptor tyrosine kinase (RTK) enzymes, and treatment with RTK inhibitors is initially successful, but over half of patients develop resistance, indicating a need for better treatments. Researchers recently investigated whether the drug THZ1, an inhibitor of the protein CDK7 that’s effective in other cancers, could help. They first confirmed that CDK7, which helps regulate the cell life cycle and gene transcription, was overexpressed in high-risk human GISTs. They also found that CDK7 overexpression predicted a poor outcome. However, low-dose THZ1 exerted pronounced anticancer effects in GIST cells both in vitro and in a mouse model. THZ1 also synergized with the RTK inhibitor imatinib to increase its efficacy..."
The rest of the transcript, along with a link to the research itself, is available on the resource itself.
This textbook is an adaptation of the Saylor Introduction to Chemistry book …
This textbook is an adaptation of the Saylor Introduction to Chemistry book customized for CH 104 at Central Oregon Community College. Low-cost print available: http://www.lulu.com/shop/forrest-towne/introduction-to-chemistry/paperback/product-24034383.html
Upon completing this course students will:
Interpret the periodic table to describe elements of atomic structure for the elements and to make predictions about properties based on the position of elements on the table. Apply atomic theory in describing atomic structure, making predictions about bonding and compound formation, and interpreting chemical reactions. Construct and interpret Lewis structures as models for ionic and covalent compounds. Describe ionic and covalent bonding and distinguish between the two, including descriptions of substances of each type at the observable scale. Solve problems using dimensional analysis involving chemical substances and reactions, drawing on understanding of the mole concept, formula masses and reaction stoichiometry. Read, write, and interpret balanced chemical equations, using proper equation syntax and standard symbolism to link such descriptions to phenomena that occur at the observable scale. Interpret and carry out a set of written experimental instructions and then to convey the experimental results in a laboratory report. Apply kinetic-molecular theory to describe solids, liquids, and gases. Recognize acids and describe acidity according to the Bronsted-Lowry definition. Use scientific (inductive) reasoning to draw appropriate conclusions from data sets or theoretical models. Characterize arguments as scientific, or not scientific. Make measurements and operate with numbers properly to convey appropriate levels of certainty when drawing conclusions from experimental data. Identify patterns in data by graphical means.
Submitted as part of the California Learning Resource Network (CLRN) Phase 3 …
Submitted as part of the California Learning Resource Network (CLRN) Phase 3 Digital Textbook Initiative (CA DTI3), CK-12 Advanced Probability and Statistics introduces students to basic topics in statistics and probability but finishes with the rigorous topics an advanced placement course requires. Includes visualizations of data, introduction to probability, discrete probability distribution, normal distribution, planning and conducting a study, sampling distributions, hypothesis testing, regression and correlation, Chi-Square, analysis of variance, and non-parametric statistics.
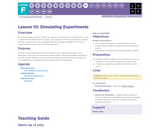
By running a simple simulation in Sprite Lab, students will experience how …
By running a simple simulation in Sprite Lab, students will experience how computing can be used to collect data that identify trends or patterns. After running the simulation multiple times, students will have an opportunity to make a prediction about how changing a variable in the simulation might impact the outcome, and then test that hypothesis.
This lesson asks students to consider carefully the assumptions they make when …
This lesson asks students to consider carefully the assumptions they make when interpreting data and data visualizations. The class begins by examining how the Google Flu Trends project tried and failed to use search trends to predict flu outbreaks. They will then read a report on the Digital Divide which highlights how access to technology differs widely by personal characteristics like race and income. This report challenges a widespread assumption that data collected online is representative of the population at large. To practice identifying assumptions in data analysis, students are provided a series of scenarios in which data-driven decisions are made based on flawed assumptions. They will need to identify the assumptions being made (most notably those related to the digital divide) and explain why these assumptions lead to incorrect conclusions.
Students begin this lesson by investigating some of the world’s biggest data …
Students begin this lesson by investigating some of the world’s biggest data breaches to get a sense for how frequently data breaches happen within companies and organizations, and what kinds of data and information is lost or given up. Afterwards, students will use the Data Privacy Lab tool to investigate just how easily they could be uniquely identified with a few seemingly innocuous pieces of information. At the conclusion of the lesson, students will research themselves online to determine just how much someone could learn about them by conducting the same searches and “connecting the dots.”
In this lesson, students gain more practice using **while** loops as they …
In this lesson, students gain more practice using **while** loops as they develop a simulation that repeatedly flips coins until certain conditions are met. The lesson begins with an unplugged activity in which students flip a coin until they get 5 heads in total, and then again until they get 3 heads in a row. They will then compete to predict the highest outcome in the class for each statistic. This activity motivates the programming component of the lesson in which students develop a program that allows them to simulate this experiment for higher numbers of heads and longer streaks.
In this kickoff to the Data Unit, students begin thinking about how …
In this kickoff to the Data Unit, students begin thinking about how data is collected and what can be learned from it. To begin the lesson, students will take a short online quiz that supposedly determines something interesting or funny about their personality. Afterwards they will brainstorm other sources of data in the world around them, leading to a discussion of how that data is collected. This discussion motivates the introduction of the Class Data Tracker project that will run through the second half of this unit. Students will take the survey for the first time and be shown what the results will look like. To close the class, students will make predictions of what they will find when all the data has been collected in a couple weeks.
This is a pretty fun lesson that has two main parts. First …
This is a pretty fun lesson that has two main parts. First students warm up by reflecting on the reasons data visualizations are used to communicate about data. This leads to the main activity in which students look at some collections of (mostly bad) data visualizations, rate them, explain why a good one is effective, and also suggest a fix for a bad one.
In the second part of class students compare their experiences and create a class list of common faults and best practices for creating data visualizations. Finally, students review and read the first few pages of **Data Visualization 101: How to design charts and graphs** to see some basic principles of good data visualizations and see how they compare with the list the class came up with.
Now that students have had the chance to see and evaluate various …
Now that students have had the chance to see and evaluate various data visualizations, they will learn to make visualizations of their own. This lesson teaches students how to build visualizations from provided datasets. The levels in Code Studio provide a detailed walkthrough of how to use Google Sheets to create several different kinds of charts. While this lesson focuses on the Google Sheets tool, other tools may be substituted at the teacher’s discretion, and MS Excel support is coming soon to the lesson.
The main activity teaches students to build different chart types (scatter, line, and bar charts) from a single data set. It should be emphasized to students that the purpose of this lesson is to explore and experiment with creating different types of visualizations, not to build the perfect chart. Students will have a chance to create and customize their own charts. At the end of class, students compare their custom visualizations with those of their classmates.
In this lesson, students will collaboratively investigate some datasets and use visualization …
In this lesson, students will collaboratively investigate some datasets and use visualization tools to “discover a data story.” The lesson assumes that students know how to use some kind of visualization tool - in the previous lesson we used the charting tools of a basic spreadsheet program. Students should be working with a partner but without much teacher hand-holding. Most of the time should be spent with students poking around the data and trying to discover connections and trends using data visualization tools. It is up to them to discover a trend, make a chart, and accurately write about it.
This task was developed by high school and postsecondary mathematics and design/pre-construction …
This task was developed by high school and postsecondary mathematics and design/pre-construction educators, and validated by content experts in the Common Core State Standards in mathematics and the National Career Clusters Knowledge & Skills Statements. It was developed with the purpose of demonstrating how the Common Core and CTE Knowledge & Skills Statements can be integrated into classroom learning - and to provide classroom teachers with a truly authentic task for either mathematics or CTE courses.
This task was developed by high school and postsecondary mathematics and health …
This task was developed by high school and postsecondary mathematics and health sciences educators, and validated by content experts in the Common Core State Standards in mathematics and the National Career Clusters Knowledge & Skills Statements. It was developed with the purpose of demonstrating how the Common Core and CTE Knowledge & Skills Statements can be integrated into classroom learning - and to provide classroom teachers with a truly authentic task for either mathematics or CTE courses.
This course begins with a review of algebra specifically designed to help …
This course begins with a review of algebra specifically designed to help and prepare the student for the study of calculus, and continues with discussion of functions, graphs, limits, continuity, and derivatives. The appendix provides a large collection of reference facts, geometry, and trigonometry that will assist in solving calculus problems long after the course is over. Upon successful completion of this course, the student will be able to: calculate or estimate limits of functions given by formulas, graphs, or tables by using properties of limits and LĺÎĺ_ĺĚĺ_hopitalĺÎĺ_ĺĚĺ_s Rule; state whether a function given by a graph or formula is continuous or differentiable at a given point or on a given interval and justify the answer; calculate average and instantaneous rates of change in context, and state the meaning and units of the derivative for functions given graphically; calculate derivatives of polynomial, rational, common transcendental functions, and implicitly defined functions; apply the ideas and techniques of derivatives to solve maximum and minimum problems and related rate problems, and calculate slopes and rates for function given as parametric equations; find extreme values of modeling functions given by formulas or graphs; predict, construct, and interpret the shapes of graphs; solve equations using NewtonĺÎĺ_ĺĚĺ_s Method; find linear approximations to functions using differentials; festate in words the meanings of the solutions to applied problems, attaching the appropriate units to an answer; state which parts of a mathematical statement are assumptions, such as hypotheses, and which parts are conclusions. This free course may be completed online at any time. It has been developed through a partnership with the Washington State Board for Community and Technical Colleges; the Saylor Foundation has modified some WSBCTC materials. (Mathematics 005)
This learning video uses a simple analog setup to explore why earthquakes …
This learning video uses a simple analog setup to explore why earthquakes are so unpredictable. The setup is simple enough that students should be able to assemble and operate it on their own with a teacher's supervision. The teaching approach used in this module is known as the 5E approach, which stands for Engagement, Exploration, Explanation, Elaboration, and Evaluation. Over the course of this lesson, the basic mechanisms that give rise to the behavior of the simple analog system are explained, and further elaboration helps the students to apply their understanding of the analog system to complex fault systems that cause earthquakes
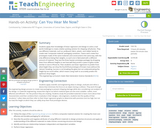
Students apply their knowledge of linear regression and design to solve a …
Students apply their knowledge of linear regression and design to solve a real-world challenge to create a better packing solution for shipping cell phones. They use different materials, such as cardboard, fabric, plastic, and rubber bands to create new “composite material” packaging containers. Teams each create four prototypes made of the same materials and constructed in the same way, with the only difference being their weights, so each one is fabricated with a different amount of material. They test the three heavier prototype packages by dropping them from different heights to see how well they protect a piece of glass inside (similar in size to iPhone 6). Then students use linear regression to predict from what height they can drop the fourth/final prototype of known mass without the “phone” breaking. Success is not breaking the glass but not underestimating the height by too much either, which means using math to accurately predict the optimum drop height.
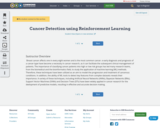
Breast cancer affects one in every eight women and is the most …
Breast cancer affects one in every eight women and is the most common cancer. e early diagnosis and prognosis of a cancer type have become a necessity in cancer research, as it can facilitate the subsequent clinical management of patients. The importance of classifying cancer patients into high or low risk groups has led many research teams, from the biomedical and the bioinformatics field, to study the application of machine learning (ML) methods. Therefore, these techniques have been utilized as an aim to model the progression and treatment of cancerous conditions. In addition, the ability of ML tools to detect key features from complex datasets reveals their importance. A variety of these techniques, including Artificial Neural Networks (ANNs), Bayesian Networks (BNs), Support Vector Machines (SVMs) and Decision Trees (DTs) have been widely applied in cancer research for the deelopment of predictive models, resulting in effective and accurate decision making.
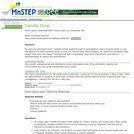
By using the discrepant event of dropping a burning candle in a …
By using the discrepant event of dropping a burning candle in a jar, students will predict, experiment, and discuss why the candle goes out as soon as it is caught.
No restrictions on your remixing, redistributing, or making derivative works. Give credit to the author, as required.
Your remixing, redistributing, or making derivatives works comes with some restrictions, including how it is shared.
Your redistributing comes with some restrictions. Do not remix or make derivative works.
Most restrictive license type. Prohibits most uses, sharing, and any changes.
Copyrighted materials, available under Fair Use and the TEACH Act for US-based educators, or other custom arrangements. Go to the resource provider to see their individual restrictions.