Updating search results...

Search Resources

291 Results

View
Selected filters:
  • Measurement and Data
  • College / Upper Division
Calculating a Simple Phase Diagram: Diamond=Graphite
Conditional Remix & Share Permitted
CC BY-NC-SA
Rating
0.0 stars

This is a very short exercise designed to get students to understand how the Gibbs energy equation is used to calculate the location of a reaction in P-T space. I use it in-class and have students work on it in groups.

Besides calculating the location of one reactions, students also have to think a bit about the significance of volume and entropy with regard to mineral stability.

This exercise is very straightforward EXCEPT that students get the units (bars, Kbar, cc, etc.) confused.

(Note: this resource was added to OER Commons as part of a batch upload of over 2,200 records. If you notice an issue with the quality of the metadata, please let us know by using the 'report' button and we will flag it for consideration.)

Subject:
Biology
Life Science
Mathematics
Measurement and Data
Physical Science
Physics
Statistics and Probability
Material Type:
Activity/Lab
Provider:
Science Education Resource Center (SERC) at Carleton College
Provider Set:
Teach the Earth
Author:
Dexter Perkins
Date Added:
09/08/2020
Carbon Sequestration of Eastside Neighborhood Trees
Conditional Remix & Share Permitted
CC BY-NC-SA
A Case Study: Geology, Remediation, Investigation at a RR Repair Shop Brownfield Site, St. Paul, Minnesota
Conditional Remix & Share Permitted
CC BY-NC-SA
Rating
0.0 stars

A case-study approach can be used to introduce students to the work that geologists do as environmental consultants. Data used by environmental consultants for a Brownfield site that is currently undergoing redevelopment in St. Paul, MN has been adapted for in-class study, either as a series of short exercises, or as part of a larger project.

(Note: this resource was added to OER Commons as part of a batch upload of over 2,200 records. If you notice an issue with the quality of the metadata, please let us know by using the 'report' button and we will flag it for consideration.)

Subject:
Chemistry
Mathematics
Measurement and Data
Physical Science
Statistics and Probability
Material Type:
Activity/Lab
Case Study
Provider:
Science Education Resource Center (SERC) at Carleton College
Provider Set:
Teach the Earth
Author:
Kate Kleiter
Date Added:
08/12/2019
Chemical Differentiation in the Palisades Sill
Conditional Remix & Share Permitted
CC BY-NC-SA
Rating
0.0 stars

The purpose of this assignment is for students to synthesize field observations, petrography, and whole-rock chemical analyses in order to investigate chemical differentiation processes in a basaltic magma chamber. The students first complete a petrography lab on both hand samples and thin sections that represent a complete stratigraphic section through sill at Fort Lee, NJ. I then provide them with major- and trace-element data and a table of distribution coefficients for common phases that would be crystallizing from basaltic magma. I then ask them to discuss the chemical differentiation of the sill by writing up a 1-2 page interpretative summary based on their petrographic observations and the chemical data.

(Note: this resource was added to OER Commons as part of a batch upload of over 2,200 records. If you notice an issue with the quality of the metadata, please let us know by using the 'report' button and we will flag it for consideration.)

Subject:
Biology
Chemistry
Life Science
Mathematics
Measurement and Data
Physical Science
Statistics and Probability
Material Type:
Activity/Lab
Data Set
Lesson Plan
Provider:
Science Education Resource Center (SERC) at Carleton College
Provider Set:
Teach the Earth
Author:
Matthew Gorring
Date Added:
08/06/2019
Climate as Constraint
Conditional Remix & Share Permitted
CC BY-NC-SA
Rating
0.0 stars

Introduction:
Groundwater is key to Texas future and economy. The resource has long been a focus of legislative and economic interest. In the earliest days, the resource was viewed as 'occult and hidden.' That sense of mystery remains even as groundwater becomes more critical to the water resource picture for the state.
Since 1951, the state conducts regional water planning with the involvement of citizen stakeholders. Let's use your science-based knowledge of groundwater flow to see if you can find the right balance for both protecting and planning for groundwater use.
Our Case:
This week we will evaluate a historic court case from June 13, 1904. The case of East versus Texas Central Railroad Company is the Texas Supreme Ruling that provides the foundation for Texas groundwater law -- Rule of Capture.
In the appendix, you will find the following figures to help you determine whether or not Mr. East's well was impacted by the railroad company's pumping:

Platt map showing well locations and possible distances
Schematics of the well dimensions, along with simplified subsurface geology in the area.

In addition, you will be interested in knowing that the Geologic Atlas of Texas shows that the wells were likely completed in the Pawpaw Formation, which is a thick calcareous clay unit in the lower sections and cemented sand in the upper part. Lithologies in the area are reported to yield limited to moderate amounts of water in shallow wells. You can expect that the formation was an unconfined unit and assume that the East well is down-gradient from the Railroad well.
Assignment Part One:

1. Using the information from our last lecture, what do you think a reasonable transmissivity rate might be for the Pawpaw formation?

a. Estimate a transmissvity for a cemented sand unit.
b. Use this value as your first estimate in calculations to calculate the potential drawdown with Jacob's equation. This calculates the drawdown in an nonleaky artesian aquifer, sa, given the observed water table drawdowns.

sa = swt -- (s2st/2m)

c. Calculate swt using a correction equation.

Swt = m-(m2-2msa)1/2

Where m is the initial saturated thickness, which you may estimate at 30 ft.

2. How much water do you estimate that the railroad can extract before the well is impacted? Complete a diagram showing estimated drawdown (ft) on the y-axis and distances from the Railroad well (ft) using different transmissivity values and different distances. What do you discover about the case?
3. With your hydrogeologic analysis, do you believe that the East well was impacted by the railroad well? Can you explain how significant the impact may or may not have been?

Climate Considerations:
Is it possible that climate conditions could have impacted conditions in the well? Visit the Greenleaf website ([greenleaf.unl.edu/downloads/scPDSI.zip]) and access data for Palmer Drought Severity Indices. Looking at this data, complete the next questions.
Assignment Part 2:

4. Looking at the drought severity index maps of Texas from October 1900 to September 1902. What kind of implications might climate conditions have had on the groundwater conditions?
5. If climate conditions worsened, what do you think would happen to the wells?

Reference:
Mace, R.E., Ridgeway, C., and Sharp, J.M., 2004, Groundwater is no longer secret and occult - A historical and hydrogeologic analysis of the East case, 100 Years of Rule of Capture: From East to Groundwater Management, ed. Mullican, W.F. and Schwarz, S., Report 361, Texas Water Development Board, 63-86 pp.
Appendix -- support documents:
Figure 1 shows that Mr. East lived in Denison County, TX. The inset is a plan view map showing the potential locations of the wells in the town.
(in supporting documents)
Figure 2: Schematic of well dimensions and simplified geology.
(In supporting documents)

(Note: this resource was added to OER Commons as part of a batch upload of over 2,200 records. If you notice an issue with the quality of the metadata, please let us know by using the 'report' button and we will flag it for consideration.)

Subject:
Biology
Hydrology
Life Science
Mathematics
Measurement and Data
Physical Science
Statistics and Probability
Material Type:
Activity/Lab
Provider:
Science Education Resource Center (SERC) at Carleton College
Provider Set:
Teach the Earth
Author:
Suzanne Pierce
Date Added:
08/29/2019
Comparative Planetary Geomorphology
Conditional Remix & Share Permitted
CC BY-NC-SA
Rating
0.0 stars

Prior to this lab exercise, students discuss general physical differences between the planets Earth, Moon and Mars, and why these physical differences exist. They use globes and global data sets in lecture to investigate large-scale patters, similarities and differences between these bodies. They discuss methods by which planetary geologists study the surfaces of other planets. While working on this laboratory exercise, they use maps of the Earth, Moon and Mars (both geologic and topographic) as well as data from missions such as Clementine, MOLA, and HRSC, which they obtain online. The investigate impact crater morphology between the Earth and Moon; comparative planetary geology in the form of fluvial, tectonic, and volcanologic comparisons of Earth and Mars; and complete a geologic map and history of a region of Mars using only orbital images and data sets.

(Note: this resource was added to OER Commons as part of a batch upload of over 2,200 records. If you notice an issue with the quality of the metadata, please let us know by using the 'report' button and we will flag it for consideration.)

Subject:
Biology
Life Science
Mathematics
Measurement and Data
Physical Geography
Physical Science
Material Type:
Activity/Lab
Provider:
Science Education Resource Center (SERC) at Carleton College
Provider Set:
Teach the Earth
Author:
Jennifer Anderson
Date Added:
08/10/2019
Compositional Diversity in Volcanic Suites
Conditional Remix & Share Permitted
CC BY-NC-SA
Rating
0.0 stars

In this exercise, students use whole-rock major- and trace-element compositions of volcanic rocks to explore the origins of compositional variation in igneous suites. Large datasets from the Yellowstone and Crater Lake calderas are downloaded from the GEOROC database, imported into Excel spreadsheets, and graphed to learn about the different petrogeneses of these two volcanic suites.

(Note: this resource was added to OER Commons as part of a batch upload of over 2,200 records. If you notice an issue with the quality of the metadata, please let us know by using the 'report' button and we will flag it for consideration.)
Subject:
Biology
Chemistry
Geoscience
Life Science
Mathematics
Measurement and Data
Physical Science
Statistics and Probability
Material Type:
Activity/Lab
Data Set
Lesson Plan
Provider:
Science Education Resource Center (SERC) at Carleton College
Provider Set:
Teach the Earth
Author:
Kent Ratajeski
Date Added:
08/19/2020
Consequences of Modern Energy Use: A Remote Sensing analysis of the gulf oil spill using ArcGIS software.
Conditional Remix & Share Permitted
CC BY-NC-SA
Rating
0.0 stars

This laboratory activity takes place in a computer lab that is equipped with ArcGIS (we are currently using ArcGIS 9.3). Students will go to NASA's oil spill gallery website and download the full size image of the Deepwater Horizon oil slick from July 14th, 2010 taken by the Moderate Resolution Imaging Spectroradiometer (MODIS) on NASA's Aqua satellite at 1:55 p.m. Central Daylight Time. Their task is to to analyze the satellite imagery as an RGB composite and to experiment with reclassification techniques to subdivide the continuous raster dataset into user-defined numbers of ranges that will help visualize the oil spill. The activity introduces students to GIS software, remote sensing analysis, and sets up questions on spatial patterns and consequences of energy use.

(Note: this resource was added to OER Commons as part of a batch upload of over 2,200 records. If you notice an issue with the quality of the metadata, please let us know by using the 'report' button and we will flag it for consideration.)

Subject:
Biology
Chemistry
Life Science
Mathematics
Measurement and Data
Oceanography
Physical Science
Material Type:
Activity/Lab
Provider:
Science Education Resource Center (SERC) at Carleton College
Provider Set:
Teach the Earth
Author:
Jared Beeton
Date Added:
08/27/2019
Conservation Biology GIS lab exploration
Conditional Remix & Share Permitted
CC BY-NC-SA
Rating
0.0 stars

Introductory exploration of GIS as a conservation biology tool. This activity was designed as a one time use of GIS to support Conservation Biology (taught by another professor) a senior level elective biology course.

Subject:
Education
Educational Technology
Mathematics
Measurement and Data
Material Type:
Activity/Lab
Homework/Assignment
Provider:
Science Education Resource Center (SERC) at Carleton College
Provider Set:
Teach the Earth
Author:
Rose McKenney
Date Added:
01/20/2023
Constructing a data-driven rainfall-runoff model
Conditional Remix & Share Permitted
CC BY-NC-SA
Rating
0.0 stars

The objective of this lesson is to introduce students to rainfall-runoff modeling using machine learning algorithms. In this lesson, students will walk through the process of accessing data, visualizing the data, statistically analyzing the data and using machine learning software packages to construct rainfall-runoff models.

(Note: this resource was added to OER Commons as part of a batch upload of over 2,200 records. If you notice an issue with the quality of the metadata, please let us know by using the 'report' button and we will flag it for consideration.)

Subject:
Biology
Life Science
Mathematics
Measurement and Data
Statistics and Probability
Material Type:
Activity/Lab
Lesson
Provider:
Science Education Resource Center (SERC) at Carleton College
Provider Set:
Teach the Earth
Author:
Tianfang Xu
Date Added:
12/22/2019
Continental Crust Mass Balance Calculation
Conditional Remix & Share Permitted
CC BY-NC-SA
Rating
0.0 stars

A quantitative skills-intensive exercise using data from the Mineral Mountains, Utah, to calculate mass balance and to address the "space problem" involved with emplacing plutons into the crust.

(Note: this resource was added to OER Commons as part of a batch upload of over 2,200 records. If you notice an issue with the quality of the metadata, please let us know by using the 'report' button and we will flag it for consideration.)

Subject:
Biology
Chemistry
Geology
Geoscience
Life Science
Mathematics
Measurement and Data
Physical Science
Statistics and Probability
Material Type:
Activity/Lab
Provider:
Science Education Resource Center (SERC) at Carleton College
Provider Set:
Teach the Earth
Author:
Jennifer Wenner
Date Added:
08/23/2019
Contractional Strain
Conditional Remix & Share Permitted
CC BY-NC-SA
Rating
0.0 stars

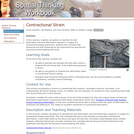
Students use gesture to describe the bulk deformation and local deformation apparent in images of a contractional analog experiment. Students then calculate bulk shortening and bulk thickening for the experiment and describe the structures accommodating that strain.

(Note: this resource was added to OER Commons as part of a batch upload of over 2,200 records. If you notice an issue with the quality of the metadata, please let us know by using the 'report' button and we will flag it for consideration.)
Subject:
Biology
Geoscience
Life Science
Mathematics
Measurement and Data
Physical Science
Statistics and Probability
Material Type:
Activity/Lab
Provider:
Science Education Resource Center (SERC) at Carleton College
Provider Set:
Teach the Earth
Author:
Carol Ormand
Date Added:
09/01/2022
Cracking and Crumbling: Exploring Mechanisms of Dike Emplacement
Conditional Remix & Share Permitted
CC BY-NC-SA
Rating
0.0 stars

This case study is based on exercises developed by Dave Pollard and uses images and mapping from Delaney and Pollard (1981). Students explore mechanisms of dike emplacement by measuring dike thicknesses along two segments of a dike intruded into shale near Ship Rock, New Mexico and mapped by Paul Delaney. Students then compare the observed dike profiles to a mechanical model -- the solution for a crack filled with magma under uniform pressure. Using the equation for opening of the crack students estimate the driving stress (difference between the magma pressure and remote principal stress acting perpendicular to the dike plane) using several different estimates of the rock stiffness parameters. Students are then asked to observe how well their best-fit model fits the two dike profiles and to investigate the map further and hypothesize why the observed widths may deviate from the simple model. Deviations from the mechanical model can lead to discussions on mechanical interaction as well as brecciation and stoping.

(Note: this resource was added to OER Commons as part of a batch upload of over 2,200 records. If you notice an issue with the quality of the metadata, please let us know by using the 'report' button and we will flag it for consideration.)
Subject:
Biology
Life Science
Mathematics
Measurement and Data
Statistics and Probability
Material Type:
Activity/Lab
Case Study
Provider:
Science Education Resource Center (SERC) at Carleton College
Provider Set:
Teach the Earth
Author:
Phil Resor
Date Added:
08/18/2019
Creating and Analyzing Folds in Visible Geology
Conditional Remix & Share Permitted
CC BY-NC-SA
Rating
0.0 stars

This activity utilizes Visible Geology to analyze folds on a stereonet using a pi-girdle technique. The assignment starts with students following a simple example, and then creating their own and sharing it with a partner. Students are introduced to concepts of fold axis, axial plane, interlimb angle in three-visualizations: model view, cross-section view, and stereonet view. By moving between these media students are able to draw deeper connections with respect to folding and to stereonet interpretation.

(Note: this resource was added to OER Commons as part of a batch upload of over 2,200 records. If you notice an issue with the quality of the metadata, please let us know by using the 'report' button and we will flag it for consideration.)

Subject:
Biology
Life Science
Mathematics
Measurement and Data
Statistics and Probability
Material Type:
Activity/Lab
Provider:
Science Education Resource Center (SERC) at Carleton College
Provider Set:
Teach the Earth
Author:
Rowan Cockett
Date Added:
09/30/2022
Critiquing Crummy Maps
Conditional Remix & Share Permitted
CC BY-NC-SA
Rating
0.0 stars

Students are given a printout of several not very good maps and asked to critique them as a group. The maps are then projected at the front of the room one at a time and each group contributes their ideas.

Subject:
Education
Educational Technology
Mathematics
Measurement and Data
Material Type:
Activity/Lab
Provider:
Science Education Resource Center (SERC) at Carleton College
Provider Set:
Teach the Earth
Author:
Emily Burns
Date Added:
01/20/2023
Crystal Structures as Geobarometers
Conditional Remix & Share Permitted
CC BY-NC-SA
Rating
0.0 stars

This exercise is based on the recent formulation of a geobarometer based on the crystal structure of clinopyroxene (Nimis, 1995; 1998; 1999). This method relates structural parameters (e.g., the volumes of the unit cell and the M1 polyhedron) to the pressure at which the mineral crystallizes within basic and ultrabasic magmas.

In this exercise, students are guided into the American Mineralogist Crystal Structure Database to retrieve and download published crystal structure data for viewing in either the CrystalMaker or XtalDraw visualization software packages. The students are instructed on how to examine the structures to determine pressure-sensitive crystallographic parameters and are asked a series of questions related to what they learn.

(Note: this resource was added to OER Commons as part of a batch upload of over 2,200 records. If you notice an issue with the quality of the metadata, please let us know by using the 'report' button and we will flag it for consideration.)

Subject:
Chemistry
Geoscience
Mathematics
Measurement and Data
Physical Science
Statistics and Probability
Material Type:
Activity/Lab
Data Set
Diagram/Illustration
Interactive
Lesson Plan
Provider:
Science Education Resource Center (SERC) at Carleton College
Provider Set:
Teach the Earth
Author:
Kent Ratajeski
Date Added:
08/08/2019
Crystallization- Differentiation of Basaltic Magma
Conditional Remix & Share Permitted
CC BY-NC-SA
Rating
0.0 stars

In this exercise, students use major-element compositions of whole-rocks, volcanic glasses, and minerals in lavas and drill cores from the solidified Kilauea Iki lava lake. The data is presented in the form of a "precompiled" spreadsheet which contains selected analyses culled from the GEOROC database and a USGS Open File report. Students make graphs from the data to learn about the petrologic processes related to the eruption and in situ crystallization of basaltic magma

(Note: this resource was added to OER Commons as part of a batch upload of over 2,200 records. If you notice an issue with the quality of the metadata, please let us know by using the 'report' button and we will flag it for consideration.)

Subject:
Biology
Chemistry
Geoscience
Life Science
Mathematics
Measurement and Data
Physical Science
Statistics and Probability
Material Type:
Activity/Lab
Data Set
Interactive
Lesson Plan
Provider:
Science Education Resource Center (SERC) at Carleton College
Provider Set:
Teach the Earth
Author:
Kent Ratajeski
Date Added:
08/07/2019
Cyber-mapping for Teaching Undergraduate Geosciences Courses
Conditional Remix & Share Permitted
CC BY-NC-SA
Rating
0.0 stars

To prepare to these labs, students will attend discussions on describing the geometry of geological structures, strain analysis and geological cross-sections.

(Note: this resource was added to OER Commons as part of a batch upload of over 2,200 records. If you notice an issue with the quality of the metadata, please let us know by using the 'report' button and we will flag it for consideration.)
Subject:
Biology
Life Science
Mathematics
Measurement and Data
Material Type:
Activity/Lab
Provider:
Science Education Resource Center (SERC) at Carleton College
Provider Set:
Teach the Earth
Author:
Mohamed Abdelsalam
Date Added:
05/27/2020
Data Analysis in the Psychological Sciences: A Practical, Applied, Multimedia Approach
Conditional Remix & Share Permitted
CC BY-NC-SA
Rating
0.0 stars

This open resources textbook contains 10 Units that describe and explain the main concepts in statistical analysis of psychological data (managing data, measures of central tendency, measures of spread, correlations, simple linear regression). In addition to conceptual descriptions and explanations of the basic analyses for descriptive statistics, this textbook also explains how to conduct those analyses with common statistical software (Excel) and open-source free software (R). This book is directed to undergraduates studying basic statistics, especially basic statistics in psychological research.

Subject:
Mathematics
Measurement and Data
Psychology
Social Science
Statistics and Probability
Material Type:
Textbook
Provider:
University of Iowa
Provider Set:
Iowa Research Online
Author:
J. Toby Mordkoff
Leyre Castro
Date Added:
02/02/2023
Data-Driven Learning Personas
Only Sharing Permitted
CC BY-ND
Rating
0.0 stars

Learn how instructional designers use data to inform the creation of a Learning Persona. Learning Personas help determine the needs of the training and help ...

Subject:
Business and Communication
Career and Technical Education
Communication
Education
Mathematics
Measurement and Data
Material Type:
Lesson
Author:
LAPU
Date Added:
03/02/2023