Unrestricted Use
Public Domain
Free PowerPoint Click and Reveal Interactions
- Subject:
- Educational Technology
- Material Type:
- Interactive
- Author:
- Tony Vinckx
- Date Added:
- 03/02/2024
Free PowerPoint Click and Reveal Interactions
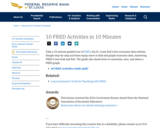
Take a 10-minute guided tour of FRED, the St. Louis Fed's free economic data website. Simple step-by-step activities equip users to find and graph economic data, mastering FRED's look and feel. The guide also shows how to customize, save, and share a FRED graph.
This site recounts the struggle for control of Hawaii between native Hawaiians and American business interests in the late 1800s. This 1897 petition and a lobbying effort by native Hawaiians convinced the U.S. Congress not to annex the islands. But months later the U.S.S. Maine exploded in Havana and the Spanish-American War began. The U.S. needed a mid-Pacific fueling station and naval base.
Primary source images, standards correlation, and teaching activities are included in this resource.
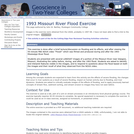
An exercise on the effects of flooding that took place in the upper Mississippi River drainage basin in 1993, using before and after satellite images.
(Note: this resource was added to OER Commons as part of a batch upload of over 2,200 records. If you notice an issue with the quality of the metadata, please let us know by using the 'report' button and we will flag it for consideration.)
Analyze the effect of a 1996 controlled flood on a sandbar in Grand Canyon. This exercise uses Spatial Analyst and 3D Analyst.
(Note: this resource was added to OER Commons as part of a batch upload of over 2,200 records. If you notice an issue with the quality of the metadata, please let us know by using the 'report' button and we will flag it for consideration.)
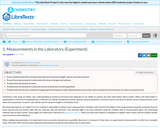
Chemistry is the study of matter. Our understanding of chemical processes thus depends on our ability to acquire accurate information about matter. Often, this information is quantitative, in the form of measurements. In this lab, you will be introduced to some common measuring devices, and learn how to use them to obtain correct measurements, each with correct precision. A metric ruler will be used to measure length in centimeters (cm).
This is complete workout for the first day of practice at Modesto Junior College.It gives the sets and the total yards for the workout.
This is a problem-based learning (PBL) group jigsaw activity. The scenario is:
Students are employees of a unit of the United Nations responsible for coordinating disaster relief after a major disaster (the 2004 Asian Earthquake and Tsunami) occurs. The agency needs to understand the situation in each country so that it can coordinate the work of various governments and nongovernmental organizations (NGOs) working in the affected area.
Students are divided into Expert Groups (related to academic specialties such as Economics, Medicine, Political Science, Earth Science, etc.) and spend several days researching their topics. Students are then reassigned to one of seven or eight Country Groups, based on the countries most affected by the disaster. Each country group needs someone representing each expert group. In the scenario, these groups correspond to task forces that must determine what the situation is in each country and try to assess the current need for international assistance.
Students research their country, using internet resources, especially the CIA World Factbook and ReliefWeb, the information coordination website of the United Nations. At a large-group roundtable discussion, each group presents what it has found about its assigned country. As a final product, each student writes an individual report summarizing findings and making recommendations for disaster assistance.
(Note: this resource was added to OER Commons as part of a batch upload of over 2,200 records. If you notice an issue with the quality of the metadata, please let us know by using the 'report' button and we will flag it for consideration.)
Students are employees of a unit of the United Nations responsible for coordinating disaster relief after a major disaster (the 2004 Asian Earthquake and Tsunami) occurs. The agency needs to understand the situation in each country so that it can coordinate the work of various governments and NGO (nongovernmental organizations) working in the affected area.
(Note: this resource was added to OER Commons as part of a batch upload of over 2,200 records. If you notice an issue with the quality of the metadata, please let us know by using the 'report' button and we will flag it for consideration.)
In this multi-part activity, students study seismograms from 3 different seismic stations recording the magnitude 9.0 Sumatra earthquake of December 26th, 2004. By comparing the arrival times of the P and S waves on each seismogram, students determine the distance from the epicenter to each station. Using that data, they can accurately map the location of the epicenter and the precise time of the earthquake. After locating the epicenter, students calculate the position of the tsunami generated by the quake at one hour intervals. From those determinations, predictions are made about how much time people had before the tsunami crashed onto their shores. Finally, students investigate some of the ways people can lessen the impact of the next great tsunami.
(Note: this resource was added to OER Commons as part of a batch upload of over 2,200 records. If you notice an issue with the quality of the metadata, please let us know by using the 'report' button and we will flag it for consideration.)
This activity uses data collected from DART (Deep-ocean Assessment and Reporting of Tsunamis) stations in the Pacific following the 2011 tsunami generated off the coast of Japan. Students are required to map the wave front after 5, 10, and 15 hours to better understand the speed and propagation of the tsunami wave.
(Note: this resource was added to OER Commons as part of a batch upload of over 2,200 records. If you notice an issue with the quality of the metadata, please let us know by using the 'report' button and we will flag it for consideration.)
This exercise uses the example of the March 28, 2014 M5.1 La Habra earthquake to teach about earthquake risk and resilience in southern California. Students will examine seismic waveforms recording during the earthquake, as well as read reports from scientific agencies and news outlets to answer basic questions regarding earthquake risk and resilience.
(Note: this resource was added to OER Commons as part of a batch upload of over 2,200 records. If you notice an issue with the quality of the metadata, please let us know by using the 'report' button and we will flag it for consideration.)

SR Caucus Business/Networking Meeting Minutes June 2022
MLA SR Caucus-Mid Year Meeting Minutes October 2022
SR Caucus 2023 April Business Meeting Minutes
This interactive addresses the question if we can reduce CO2 emissions by 20% of 1990 levels and help avoid dangerous climate change? Users of this interactive can manipulate changes to various sources and uses (supply and demand) of energy with the goal of reducing C02 emissions in Great Britain by 80% in the year 2050.
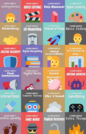
23 Things is a suite of 23 self-paced online modules that cover a range of topics from video editing to basic coding. Each module or 'thing' consists of information, interactive activities, and invitations to try out various open and free software applications and technologies. The modules have been created using H5P and can be downloaded individually as a single H5P file, modified and re-used under a CC-BY-SA licence - simply click on the 'reuse' link at the bottom of each module.
The content was created by Curtin University students as part of a 'students as partners' project.
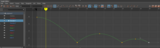
A simple step-by-step guide to working with the maya graphe editor by creating a bouncing ball.
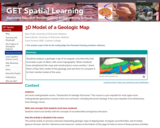
Play-Doh model of a geologic map
Provenance: Carol Ormand Ph.D., Carleton College
Reuse: This item is offered under a Creative Commons Attribution-NonCommercial-ShareAlike license http://creativecommons.org/licenses/by-nc-sa/3.0/ You may reuse this item for non-commercial purposes as long as you provide attribution and offer any derivative works under a similar license.
Students analyze a geologic map of an angular unconformity that truncates a pair of dikes, with some topography. When students have deciphered the map and constructed a cross-section, I show them a Play-Doh model of the geology and ask them to compare it to their mental model of the area.
(Note: this resource was added to OER Commons as part of a batch upload of over 2,200 records. If you notice an issue with the quality of the metadata, please let us know by using the 'report' button and we will flag it for consideration.)
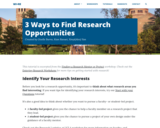
Interested in research but can't find any opportunities? Look no further! Check out these quick strategies for getting started with research!
Learning Outcomes:
Identify three strategies for finding research opportunities.