This material is a detailed exercise for students in introductory statistics. Students …
This material is a detailed exercise for students in introductory statistics. Students are asked to collect a random sample of data from a real estate website; conduct descriptive statistics (including confidence intervals); and write a report summarizing their findings.
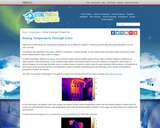
This article describes the basics of thermography or thermal imaging, and how …
This article describes the basics of thermography or thermal imaging, and how this technique can inspire a data collection activity to teach about heat transfer and energy efficiency.
Students modify a provided App Inventor code to design their own diseases. …
Students modify a provided App Inventor code to design their own diseases. This serves as the evolution step in the software/systems design process. The activity is essentially a mini design cycle in which students are challenged to design a solution to the modification, implement and test it using different population patterns The result of this process is an evolution of the original app.
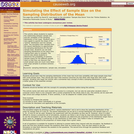
Solar scientists need you! Help them spot explosions on the Sun and …
Solar scientists need you! Help them spot explosions on the Sun and track them across space to Earth. Your work will give astronauts an early warning if dangerous solar radiation is headed their way. And you could make a new scientific discovery.
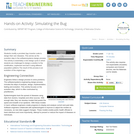
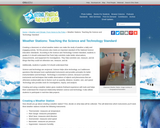
This course introduces students to basic properties of structural materials and behavior …
This course introduces students to basic properties of structural materials and behavior of simple structural elements and systems through a series of experiments. Students learn experimental technique, data collection, reduction and analysis, and presentation of results. Students generally take this subject during the same semester as 1.050, Solid Mechanics.
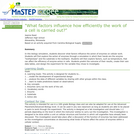
This group activity focuses on conducting an experiment to determine which of …
This group activity focuses on conducting an experiment to determine which of two brands of paper towels are more absorbent by measuring the amount of water absorbed. A two-sample t-test can be used to analyze the data, or simple graphics and descriptive statistics can be used as an exploratory analysis. Students are asked to think about design issues, and to write a short report stating their results and conclusions, along with an evaluation of the experimental design.
Christopher J. Malone, Christopher R. Bilder, Deborah J. Rumsey, John E. Boyer, Kansas State University, Ohio State University, Oklahoma State University
Students participating in Storm Signals play a critical role in the overall …
Students participating in Storm Signals play a critical role in the overall process of the Student Observation Network (S.O.N.). They are able to confirm the predictions of the Sunspotter's Sunspot Suspect, and they will predict magnetic storms around Earth, issuing Space Weather alerts that tell other students to begin monitoring the Magnetosphere for magnetic storms. By collecting and analyzing real-time data from their radio antennas, professional observatories, and NASA satellites, they can carry out the same duties as NASA researchers! The Space Weather alerts issued by the Space Environment Center (SEC) of NOAA (National Oceanographic and Atmospheric Administration) are essential to protect satellites, power grids and astronauts.
In Storm Signals you will learn:
1. How to instruct students in the construction of a simple device to detect radio emissions from the Sun.
2. How to enable students to obtain and interpret radio emissions from ground-based professional observatories.
3. How to enable students to obtain and interpret radio, x-ray and ultraviolet emissions from NASA satellites.
In this regular column of the free, online magazine Beyond Weather and …
In this regular column of the free, online magazine Beyond Weather and the Water Cycle, the author looks at the importance of conserving water and practicing good conservation habits daily. The column is designed for teachers in K-Grade 5 classrooms and presents concepts of climate literacy that are appropriate for young children. Identified online resources provide data collection activities, lessons, and games.
This article provides ideas, lessons and resources on how elementary teachers can …
This article provides ideas, lessons and resources on how elementary teachers can integrate map skills, math, and art into lessons about the geography of the Arctic and Antarctica.
In this classroom project, students and faculty help a local housing non-profit …
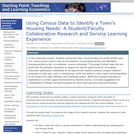
In this classroom project, students and faculty help a local housing non-profit identify area U.S. Census tracts most in need of its assistance in promoting decent and affordable homeownership to low- to moderate- income individuals. While this example describes an experience in a small, upper-level elective economics course, it includes suggestions for modifications of design and learning goals for other learning levels and environments.
Using quadrats along line transects in two different habitats, students will gather …
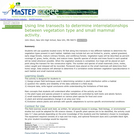
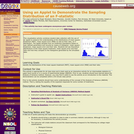
Using quadrats along line transects in two different habitats, students will gather data which will provide evidence that shows the interrelationships between vegetation types and small mammal populations
This visualization activity combines student data collection with the use of an …
This visualization activity combines student data collection with the use of an applet to enhance the understanding of the distributions of mean square treatment (MST), mean square error (MSE) as well as their ratio, an F-distribution. Students will see theoretical distributions of the mean square treatment, mean square error and their ratio and how they compare to the histograms generated by the simulated data.
Video clips from federal and regional agencies show scientists at work with …
Video clips from federal and regional agencies show scientists at work with tools used to collect data about the climate and weather. This article, from the free, online magazine Beyond Weather and the Water Cycle, will help students visualize the tools and how they are used in the atmosphere, at sea, and other hard-to-access locations.
This article links to resources to help teachers create their own weather …
This article links to resources to help teachers create their own weather stations, participate in real data projects, and assess their students' knowledge of weather tools.
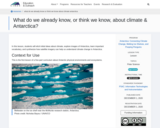
In this lesson, students will first participate in a chalk talk to …
In this lesson, students will first participate in a chalk talk to elicit initial ideas about climate and Antarctica and the types of data scientists collect. Next, they will explore images of Antarctica and make initial noticings and wonderings about what they’re seeing. Students will be introduced to important vocabulary through matching terms to components or features of a satellite image. Finally, students will synthesize their initial ideas about how satellite imagery can help us understand climate change in Antarctica. This is the first lesson of a five-part curriculum about Antarctic physical environments and ecosystems.
No restrictions on your remixing, redistributing, or making derivative works. Give credit to the author, as required.
Your remixing, redistributing, or making derivatives works comes with some restrictions, including how it is shared.
Your redistributing comes with some restrictions. Do not remix or make derivative works.
Most restrictive license type. Prohibits most uses, sharing, and any changes.
Copyrighted materials, available under Fair Use and the TEACH Act for US-based educators, or other custom arrangements. Go to the resource provider to see their individual restrictions.