Play-Doh model of a geologic map Provenance: Carol Ormand Ph.D., Carleton College …
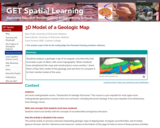
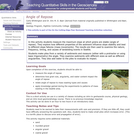
Play-Doh model of a geologic map
Provenance: Carol Ormand Ph.D., Carleton College Reuse: This item is offered under a Creative Commons Attribution-NonCommercial-ShareAlike license http://creativecommons.org/licenses/by-nc-sa/3.0/ You may reuse this item for non-commercial purposes as long as you provide attribution and offer any derivative works under a similar license. Students analyze a geologic map of an angular unconformity that truncates a pair of dikes, with some topography. When students have deciphered the map and constructed a cross-section, I show them a Play-Doh model of the geology and ask them to compare it to their mental model of the area.
(Note: this resource was added to OER Commons as part of a batch upload of over 2,200 records. If you notice an issue with the quality of the metadata, please let us know by using the 'report' button and we will flag it for consideration.)
This OER explores the basic organization of the Pythagorean Solids. It contains …
This OER explores the basic organization of the Pythagorean Solids. It contains both an activity as well as resources for further exploration. It is a product of the OU Academy of the Lynx, developed in conjunction with the Galileo's World Exhibition at the University of Oklahoma.
This is a computer-based activity in which students retrieve data from websites …
This is a computer-based activity in which students retrieve data from websites maintained by the US Geological Survey (USGS) and the National Weather Service (NWS), and then use that data to test different hypotheses regarding streamflow and precipitation. Students import data from web sites into a spreadsheet program where they can construct scatter plots and perform simple statistical tests. The activity has two components, the first focusing on relations between streamflow and drainage basin characteristics (drainage area, slope, precipitation), the second focusing on trends in annual precipitation at two locations in the USA: Burlington, VT, and Boulder, CO. As part of the second component, students conduct a statistical test to determine if the long-term trends in precipitation are significant.
(Note: this resource was added to OER Commons as part of a batch upload of over 2,200 records. If you notice an issue with the quality of the metadata, please let us know by using the 'report' button and we will flag it for consideration.)
Spreadsheets Across the Curriculum module/Geology of National Parks course. Students estimate travel …
Spreadsheets Across the Curriculum module/Geology of National Parks course. Students estimate travel times and costs of a driving/camping trip to visit national parks in Colorado.
Effective measurement techniques include the concept of measurement uncertainty. Students may make …
Effective measurement techniques include the concept of measurement uncertainty. Students may make erroneous conclusions analyzing data using measurements that do not include the uncertainty of the measurement. In this lab, students determine a density range for a metal and identify the material based on this range.
This is a lab activity that allows students to collect data to …
This is a lab activity that allows students to collect data to practice using effective measurement. While other authors have produced similar labs, this version includes uncertainty analysis consistent with effective measurement technique as presented in the module Measurement and Uncertainty.
This resource can be used in providing real-life activity for students by conducting …
This resource can be used in providing real-life activity for students by conducting survey. Results of their survey will be organized and presented through text, graphs and tables with research ethics observed.
North American ecosystems have fundamentally changed over the late Pleistocene and Holocene; …
North American ecosystems have fundamentally changed over the late Pleistocene and Holocene; from a system dominated by mammoths, to bison, to domestic livestock. Given the very different body size and herd formation of these 'ecosystem engineers', it is likely that animals influence soil structure, water tables, vegetation and other animals in the ecosystems. What has been the ecological influence of the continued 'downsizing' of the largest animals in the ecosystem?
(Note: this resource was added to OER Commons as part of a batch upload of over 2,200 records. If you notice an issue with the quality of the metadata, please let us know by using the 'report' button and we will flag it for consideration.)
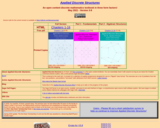
This is a learning module that uses data to investigate trends in …
This is a learning module that uses data to investigate trends in attitudes regarding the rights of homosexuals in the United States from the early 1990s through 2007.
This online set of activities help students learn properties of ocean waves, …
This online set of activities help students learn properties of ocean waves, wind-wave relationships and properties of tsunamis.
(Note: this resource was added to OER Commons as part of a batch upload of over 2,200 records. If you notice an issue with the quality of the metadata, please let us know by using the 'report' button and we will flag it for consideration.)
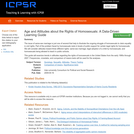
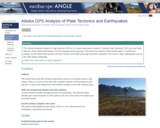
This activity introduces students to high precision GPS as it is used …
This activity introduces students to high precision GPS as it is used in geoscience research. Students build "gumdrop" GPS units and study data from three Alaska GPS stations from the Plate Boundary Observatory network. They learn how Alaska's south central region is "locked and loading" as the Pacific Plate pushes into North America and builds up energy that will be released in the future in other earthquakes such as the 1964 Alaska earthquake.
(Note: this resource was added to OER Commons as part of a batch upload of over 2,200 records. If you notice an issue with the quality of the metadata, please let us know by using the 'report' button and we will flag it for consideration.)
This lab is generally the first lab for this course. It introduces …
This lab is generally the first lab for this course. It introduces students to desmos.com and helps them become familiar with it. The lab investigates the visual changes to a line as the slope and y-intercept change.
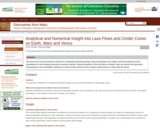
Comparative planetary geology requires understanding how geological processes are affected by changes …
Comparative planetary geology requires understanding how geological processes are affected by changes in physical environment-each planet and moon provides an opportunity to refine our understanding of how physical geological processes operate. Volcanism is a great example of a major geological process highly susceptible to such variations. Students performing this exercise will constrain how "Amboy Crater" would look if the same eruption happened on the Moon and Mars. Part 1 of the exercise asks small groups to assess either the yield strength of the Amboy flows or the time required for the flow to travel a given distance. After discussion of the results, Part 2 asks students to characterize the dimensions of the same flow, if emplaced on Mars or the Moon (changing only gravitational acceleration), and the time required for it to form; they are asked to predict the outcome in advance. Part 3 uses "Erupt" freeware by Ken Wohletz to explore how gravity changes will affect cinder cone geometry; the model is tested first to see if it correctly predicts an Amboy-like geometry, and afterwards students are asked to brainstorm what other factors should also be modified to improve the accuracy of the simulation, and how these changes would be expected to affect the geomorphological outcome. Finally, Part 4 asks students to use simple ballistic equations, implemented via an online Applet (Stromboli), to constrain the launch angle and starting velocity for the eruption that formed Amboy Crater (modifications are supposedly underway to permit this applet to run with different values of gravitational acceleration and air resistance).
(Note: this resource was added to OER Commons as part of a batch upload of over 2,200 records. If you notice an issue with the quality of the metadata, please let us know by using the 'report' button and we will flag it for consideration.)
A student activity to determine the angle of repose and what factors …
A student activity to determine the angle of repose and what factors determine the angle of repose.
(Note: this resource was added to OER Commons as part of a batch upload of over 2,200 records. If you notice an issue with the quality of the metadata, please let us know by using the 'report' button and we will flag it for consideration.)
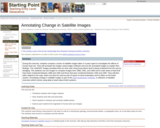
During this exercise, students compare a series of satellite images taken 3-4 …
During this exercise, students compare a series of satellite images taken 3-4 years apart to investigate the effects of human land use and annotate the images using ImageJ software.
(Note: this resource was added to OER Commons as part of a batch upload of over 2,200 records. If you notice an issue with the quality of the metadata, please let us know by using the 'report' button and we will flag it for consideration.)
In this problem set students are given Rb/Sr and 87Sr/86Sr data for …
In this problem set students are given Rb/Sr and 87Sr/86Sr data for whole rock and mineral samples from three granitic intrusions in the Sierra Nevada. They use these data (in EXCEL) to calculate isochron ages and initial ages for the intrusions and then interpret their results. This problem is intended to teach some spreadsheet skills (linear regressions, graphing) as well as having them think about the use of radiogenic isotopes.
(Note: this resource was added to OER Commons as part of a batch upload of over 2,200 records. If you notice an issue with the quality of the metadata, please let us know by using the 'report' button and we will flag it for consideration.)
Best open source book in Discrete Math. Covers all the subjects in …
Best open source book in Discrete Math. Covers all the subjects in a standard Discrete Math class for mathematics or computer science students and contains sage cells for all subjects. Set Theory, Combinatorics, Logic, Relations, Recursion, Graph Theory, Trees, Algebraic Structures, Boolean Algebras, Automata, etc. Originally published commercially, its original text was peer-reviewed and was adopted for use at several universities throughout the country. Now in its open source version, has the same quality but it is free.
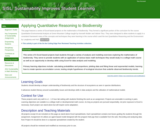
A series of 6 Excel-based projects on the mathematics of biodiversity for …
A series of 6 Excel-based projects on the mathematics of biodiversity for basic college math classes and developmental math classes. Students learn about the structure of biodiversity, the application of many basic data analysis skills, and the use of Excel for analysis and data presentation.
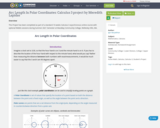
This Project has been completed as part of a standard 10 weeks …
This Project has been completed as part of a standard 10 weeks Calculus 3 asynchronous online course with optional WebEx sessions during Summer 2021 Semester at MassBay Community College, Wellesley Hills, MA.
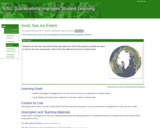
Student teams investigate Arctic Sea Ice by analyzing actual data and making …
Student teams investigate Arctic Sea Ice by analyzing actual data and making predictions. A worthwhile extension is to predict the first year that the Arctic Ocean will be ice free.
(Note: this resource was added to OER Commons as part of a batch upload of over 2,200 records. If you notice an issue with the quality of the metadata, please let us know by using the 'report' button and we will flag it for consideration.)
No restrictions on your remixing, redistributing, or making derivative works. Give credit to the author, as required.
Your remixing, redistributing, or making derivatives works comes with some restrictions, including how it is shared.
Your redistributing comes with some restrictions. Do not remix or make derivative works.
Most restrictive license type. Prohibits most uses, sharing, and any changes.
Copyrighted materials, available under Fair Use and the TEACH Act for US-based educators, or other custom arrangements. Go to the resource provider to see their individual restrictions.