Locating restaurants in an unfamiliar place, reporting potholes to the local DOT, …
Locating restaurants in an unfamiliar place, reporting potholes to the local DOT, obtaining real-time traffic conditions... All of these are examples of geospatial web apps that are revolutionizing how people obtain and share information about the world. In GEOG 863, you will learn how to build apps like these. You'll start with a quick look at the fundamentals of web programming (HTML and CSS) before diving in to using JavaScript and a mapping application programming interface (API) developed by Esri. Using this API, you'll create both 2D and 3D visualizations of your own data and learn how to develop a user interface to enable users to interact with your map.
Putting Math to Work Type of Unit: Problem Solving Prior Knowledge Students …
Putting Math to Work
Type of Unit: Problem Solving
Prior Knowledge
Students should be able to:
Solve problems involving all four operations with rational numbers. Write ratios and rates. Write and solve proportions. Solve problems involving scale. Write and solve equations to represent problem situations. Create and interpret maps, graphs, and diagrams. Use multiple representations (i.e., tables, graphs, and equations) to represent problem situations. Calculate area and volume. Solve problems involving linear measurement.
Lesson Flow
Students apply and integrate math concepts they have previously learned to solve mathematical and real-world problems using a variety of strategies. Students have opportunities to explore four real-world situations involving problem solving in a variety of contexts, complete a project of their choice, and work through a series of Gallery problems.
First, students utilize their spatial reasoning and visualization skills to find the least number of cubes needed to construct a structure when given the front and side views. Then, students select a project to complete as they work through this unit to refine their problem-solving skills. Students explore the relationship between flapping frequency, amplitude, and cruising speed to calculate the Strouhal number of a variety of flying and swimming animals. After that, students explore the volume of the Great Lakes, applying strategies for solving volume problems and analyzing diagrams. Next, students graphically represent a virtual journey through the locks of the Welland Canal, estimating the amount of drop through each lock and the distance traveled. Students have a day in class to work on their projects with their group.
Then, students have two days to explore Gallery problems of their choosing. Finally, students present their projects to the class.
This course covers the mathematical techniques necessary for understanding of materials science …
This course covers the mathematical techniques necessary for understanding of materials science and engineering topics such as energetics, materials structure and symmetry, materials response to applied fields, mechanics and physics of solids and soft materials. The class uses examples from the materials science and engineering core courses (3.012 and 3.014) to introduce mathematical concepts and materials-related problem solving skills. Topics include linear algebra and orthonormal basis, eigenvalues and eigenvectors, quadratic forms, tensor operations, symmetry operations, calculus of several variables, introduction to complex analysis, ordinary and partial differential equations, theory of distributions, and fourier analysis. Users may find additional or updated materials at Professor Carter's 3.016 course Web site.
This resource is a video abstract of a research paper created by …
This resource is a video abstract of a research paper created by Research Square on behalf of its authors. It provides a synopsis that's easy to understand, and can be used to introduce the topics it covers to students, researchers, and the general public. The video's transcript is also provided in full, with a portion provided below for preview:
"The laboratory and computational tools available to microbiome researchers have greatly improved in recent years, especially in assembling genomes from complex communities. Most of the research to date has focused on macrodiversity, which is classical ecology metrics like population abundance, α-diversity, and β-diversity. But microdiversity — population genetics metrics like single nucleotide polymorphisms (SNPs) and selective pressures — is important to consider. There are several technical and accessibility issues that hinder widespread analysis of microdiversity in metagenomic datasets, but the recently developed open-access software tool MetaPop is designed to close this gap. MetaPop provides a user-friendly interface to analyze both the macro- and microdiversity of microbial and viral community metagenomes. For small datasets, MetaPop can be run on a laptop, making it a practical choice for non-bioinformaticians or labs without access to high-powered computing..."
The rest of the transcript, along with a link to the research itself, is available on the resource itself.
This resource is a video abstract of a research paper created by …
This resource is a video abstract of a research paper created by Research Square on behalf of its authors. It provides a synopsis that's easy to understand, and can be used to introduce the topics it covers to students, researchers, and the general public. The video's transcript is also provided in full, with a portion provided below for preview:
"Reproducibility is extremely important in science. But no matter how much effort is put into standardizing protocols, small differences seem inevitable in the way experiments are performed among laboratories. These small differences can add up to discrepancies that complicate data interpretation. One field where this issue looms large is neuroscience – particularly in experiments involving histological sections of the mouse brain. Such studies require correct identification of specific brain regions for accurate interpretation of results. But the mouse brain is small and complex. Brain atlases can be invaluable in mapping, but applying this information in laboratory experiments is difficult. A new automated system aims to solve this problem by taking the guesswork – and potential observer error and bias – out of the equation. Much like a GPS system in a car, the program – called NeuroInfo – helps researchers navigate through the microscopic anatomy of a brain section..."
The rest of the transcript, along with a link to the research itself, is available on the resource itself.
This course focuses on methods of digital visualization and communication and their …
This course focuses on methods of digital visualization and communication and their application to planning issues. Lectures will introduce a variety of methods for describing or representing a place and its residents, for simulating changes, for presenting visions of the future, and for engaging multiple actors in the process of guiding action. Through a series of laboratory exercises, students will apply these methods in the construction of a web-based portfolio. The portfolio is not only the final project for the course, but will serve as a container for other course work throughout the MCP program. This course aims to introduce students to (1) such persistent and recurring themes as place, race, power and the environment that face planners, (2) the role of digital technologies in representing, analyzing, and mobilizing communities, (3) MIT faculty and their work, (4) MIT's computing environment and resources including Athena, Element K, the ESRI virtual campus, Computer Resources Laboratory (CRL), Campus Wide Information Systems Support (CWIS), the GIS Laboratory at Rotch Library and (5) software tools like Adobe® Photoshop® and Illustrator®, ESRI ArcView, Microsoft® Access, and Macromedia® Dreamweaver® that will assist them in creating digital images, working with relational databases, and launching a web-based portfolio.
City officials in Tybee Island, Georgia, recognized sea level rise as a …
City officials in Tybee Island, Georgia, recognized sea level rise as a growing problem for their community. Visualizations from a sea level rise viewer helped them raise awareness of the city's vulnerabilities and led to development of Georgias first sea level rise plan.
A whirl-wind tour of the statistics used in behavioral science research, covering …
A whirl-wind tour of the statistics used in behavioral science research, covering topics including: data visualization, building your own null-hypothesis distribution through permutation, useful parametric distributions, the generalized linear model, and model-based analyses more generally. Familiarity with MATLAB®, Octave, or R will be useful, prior experience with statistics will be helpful but is not essential. This course is intended to be a ground-up sketch of a coherent, alternative perspective to the "null-hypothesis significance testing" method for behavioral research (but don't worry if you don't know what this means).
This Learning Plan was created by Mae Clausen. Educators worked with coaches …
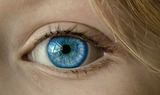
This Learning Plan was created by Mae Clausen. Educators worked with coaches to create Learning Plans.Brief Overview: Students will analyze and evaluate the comphrension strategy of visualization to clarify text and deepen understanding of the text. Students will use background knowledge to build on new knowledge and connect to the texts. Grade Level: 3rd gradeLexile Level: 420-820 Scarecrow Read Aloud: AD 600LNDE Standards: LA 3.1.6.l Build background knowledge and activate prior knowledge to identify text-to- self, text-to-text, and text-to-world connections before, during, and after reading.LA 3.1.6.n Make and confirm/modify predictions and inferences before, during, and after reading literary, informational, digital text, and/or media.Learning Objective: Students will be able to define visualization and notice it while reading and/or listening to books or short passages. Duration: 90-120 minutes to complete.
This Learning Plan was created by Mae Clausen. Educators worked with coaches …
This Learning Plan was created by Mae Clausen. Educators worked with coaches to create Learning Plans.Brief Overview: Students will analyze and evaluate the comphrension strategy of visualization to clarify text and deepen understanding of the text. Students will use background knowledge to build on new knowledge and connect to the texts. Grade Level: 3rd gradeLexile Level: 420-820 Scarecrow Read Aloud: AD 600LNDE Standards: LA 3.1.6.l Build background knowledge and activate prior knowledge to identify text-to- self, text-to-text, and text-to-world connections before, during, and after reading.LA 3.1.6.n Make and confirm/modify predictions and inferences before, during, and after reading literary, informational, digital text, and/or media.Learning Objective: Students will be able to define visualization and notice it while reading and/or listening to books or short passages. Duration: 90-120 minutes to complete.
This resource is a collection of student tutorial videos that explore various …
This resource is a collection of student tutorial videos that explore various materials science and engineering topics using visualizations in the Wolfram Mathematica programming system.
This article discusses the reading comprehension strategy of visualization and how it …
This article discusses the reading comprehension strategy of visualization and how it can be used to enhance students' understanding of content-area text. Templates and links are provided.
This resource is a video abstract of a research paper created by …
This resource is a video abstract of a research paper created by Research Square on behalf of its authors. It provides a synopsis that's easy to understand, and can be used to introduce the topics it covers to students, researchers, and the general public. The video's transcript is also provided in full, with a portion provided below for preview:
"The human body is home to numerous communities of microorganisms. While advances in genetic sequencing have enabled researchers to understand how these communities influence health and disease, these technologies are also creating more data than researchers can handle. Now, there’s animalcules. animalcules is an easy-to-use interactive toolkit for analyzing and visualizing microbiome data. Using a combination of new and existing analytics, visualization methods, and machine learning models. animalcules allows for traditional microbiome analyses, such as alpha and beta diversity and differential abundance analyses, and biomarker identification. The toolkit also generates interactive and dynamic figures that enables users to understand their data and gain new insights. animalcules can be used as a standalone command-line R package, or users can explore their data with the accompanying interactive R Shiny interface. animalcules is free to download from GitHub at https://github..."
The rest of the transcript, along with a link to the research itself, is available on the resource itself.
No restrictions on your remixing, redistributing, or making derivative works. Give credit to the author, as required.
Your remixing, redistributing, or making derivatives works comes with some restrictions, including how it is shared.
Your redistributing comes with some restrictions. Do not remix or make derivative works.
Most restrictive license type. Prohibits most uses, sharing, and any changes.
Copyrighted materials, available under Fair Use and the TEACH Act for US-based educators, or other custom arrangements. Go to the resource provider to see their individual restrictions.