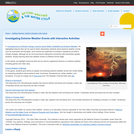
This article highlights resources that can be used to supplement lessons on …
This article highlights resources that can be used to supplement lessons on extreme weather, including games and video clips. The article appears in the free, online magazine for K-Grade 5 teachers Beyond Weather and the Water Cycle. The magazine focuses on the essential principles of climate science.
In essence, this is an opportunity for students to practice calculating trends …
In essence, this is an opportunity for students to practice calculating trends with uncertainties to draw conclusions about whether or not there is a trend in hurricane intensity. It follows closely with the IPCC AR4 findings, and is guided so that students will know exactly what they have to do - step by step. Please see the attached document for the bulk of the activity. There are some additional instructor's notes that give a little more background on the concepts involved with confidence intervals and trends. There is also an excel file with all of the necessary data already tabulated for the exercise - so you don't need to go find it yourself unless you want to.
(Note: this resource was added to OER Commons as part of a batch upload of over 2,200 records. If you notice an issue with the quality of the metadata, please let us know by using the 'report' button and we will flag it for consideration.)
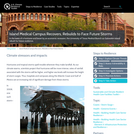
In the wake of a hurricane and beset by an economic recession, …
In the wake of a hurricane and beset by an economic recession, the University of Texas Medical Branch on Galveston Island rebuilt for future resilience.
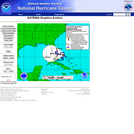
This page from the National Hurricane Center hosts a variety of still …
This page from the National Hurricane Center hosts a variety of still graphics that can be looped into animations of the storm's progress. Images include 3- and 5-day Watches and Warnings, Wind Swaths and Strike Probabilities.
In this introductory activity, students view and interpret a satellite visualization movie …
In this introductory activity, students view and interpret a satellite visualization movie of the 2005 Atlantic hurricane season that shows a composite of Atlantic Basin satellite imagery and sea surface temperatures overlaid with hurricane paths and names. Through close examination of this movie, students develop a generalized understanding of the multiple systems and process that influence hurricane life cycles. A whole class discussion of the movie after the viewing will elicit questions that form the basis of later investigations in the Investigating Hurricanes unit.
(Note: this resource was added to OER Commons as part of a batch upload of over 2,200 records. If you notice an issue with the quality of the metadata, please let us know by using the 'report' button and we will flag it for consideration.)
Students view and explore a variety of different hurricane visualizations: movies of …
Students view and explore a variety of different hurricane visualizations: movies of satellite imagery (visible and IR); composite images with rainfall intensity, wind circulation, temperature; cross sectional composites; radar imagery. Based upon their analysis of the images, they identify basic hurricanes structure, wind circulation patterns, precipitation patterns. Next, they compare their interpretation and labeling of the images with textbook or Internet derived diagrams of hurricane structure and refine their interpretation and labeling. To conclude, students are presented with images of a southern hemisphere tropical cyclone that they contrast and compare to northern hemisphere cyclones.
(Note: this resource was added to OER Commons as part of a batch upload of over 2,200 records. If you notice an issue with the quality of the metadata, please let us know by using the 'report' button and we will flag it for consideration.)
Students explore NOAA's official record of tropical storms and hurricanes, then work …
Students explore NOAA's official record of tropical storms and hurricanes, then work with the primary data and data products to identify the dates and aspects of the Atlantic hurricane season.
(Note: this resource was added to OER Commons as part of a batch upload of over 2,200 records. If you notice an issue with the quality of the metadata, please let us know by using the 'report' button and we will flag it for consideration.)
Students select a storm from the HURDAT database and create its track …
Students select a storm from the HURDAT database and create its track in the tool, Google Earth. The visualization they produce details the location and intensity of their storm through time. Afterwards, students access an online mapping tool to examine the locations and life cycles of hundreds of Atlantic storms.
(Note: this resource was added to OER Commons as part of a batch upload of over 2,200 records. If you notice an issue with the quality of the metadata, please let us know by using the 'report' button and we will flag it for consideration.)
Students graph the relationship between air pressure and wind speed in 2005's …
Students graph the relationship between air pressure and wind speed in 2005's Hurricane Katrina and for the entire 2005 hurricane season. From their analyses, they come up with an estimate of the minimum air pressure that is likely to result in hurricane-force winds of 65 knots or higher.
(Note: this resource was added to OER Commons as part of a batch upload of over 2,200 records. If you notice an issue with the quality of the metadata, please let us know by using the 'report' button and we will flag it for consideration.)
This activity allows student to investigate how hurricanes transfer heat by conducting …
This activity allows student to investigate how hurricanes transfer heat by conducting hands-on experiments.
(Note: this resource was added to OER Commons as part of a batch upload of over 2,200 records. If you notice an issue with the quality of the metadata, please let us know by using the 'report' button and we will flag it for consideration.)
Students explore issues related to the rapid intensification of hurricanes. They become …
Students explore issues related to the rapid intensification of hurricanes. They become familiar with the concepts of heat energy and the specific heat of water and interact with animations of sea surface temperature images to identify the Gulf Stream and the Loop Current. Students use NOAA View and Google Earth, free data-image tools, to explore visualizations of heat content in the Gulf of Mexico just before Hurricane Katrina. The examine a plotted path of Katrina as an overlay on these visualizations and observe changes in the heat content of Gulf waters as the hurricane passed over it.
(Note: this resource was added to OER Commons as part of a batch upload of over 2,200 records. If you notice an issue with the quality of the metadata, please let us know by using the 'report' button and we will flag it for consideration.)
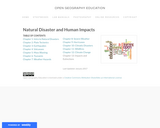
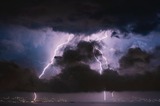
Students search for images and video that illustrate the dangers that hurricanes …
Students search for images and video that illustrate the dangers that hurricanes pose to property and life. They consult Morbidity and Mortality Reports to find the common causes of death attributed to hurricanes and to discover the challenges to counting deaths attributed to Hurricane Katrina in 2005. Students explore hazards from storm surge, high winds, and inland floding and outline a plan that would prepare them to survive a hurricane.
(Note: this resource was added to OER Commons as part of a batch upload of over 2,200 records. If you notice an issue with the quality of the metadata, please let us know by using the 'report' button and we will flag it for consideration.)
Students create a web and define the word "resilience," read a blog …
Students create a web and define the word "resilience," read a blog about the resilience of one Brooklyn school community that was hit by Hurricane Sandy, and consider what being prepared and resilient might mean at their own school.
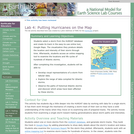
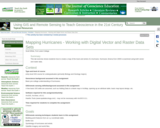
This lab exercise shows students how to create a map of the …
This lab exercise shows students how to create a map of the track and winds of a hurricane. Hurricane Jimena from 2009 is examined using both vector and raster data.
(Note: this resource was added to OER Commons as part of a batch upload of over 2,200 records. If you notice an issue with the quality of the metadata, please let us know by using the 'report' button and we will flag it for consideration.)
Lessons teach core knowledge about the science of climate change, explore conflicting …
Lessons teach core knowledge about the science of climate change, explore conflicting views, and integrate critical thinking skills. Students will apply knowledge of climate change to a rigorous analysis of media messages through asking and answering questions about accuracy, currency, credibility, sourcing, and bias. Lessons address basic climate science, the causes of climate change, scientific debate and disinformation, the consequences of global warming, the precautionary principle, carbon footprints, moral choices, and the history of global warming in media, science, and politics.
To prepare for this exercise, students will read about the Earth's energy …
To prepare for this exercise, students will read about the Earth's energy balance, the electromagnetic spectrum (including visible solar and invisible infrared energy), the effect of the earth's atmosphere, and the earth's resulting general oceanic and atmospheric circulation. For this I like Chapters 3, 4, & 5 in "The Earth System" (2nd Ed.) by Kump, Kasting, & Crane. The students' first step is to estimate zonal averages of Incoming Solar (Shortwave), Absorbed Shortwave, and Outgoing Longwave Radiation from 11x17in color maps of Earth Radiation Budget Experiment (ERBE) data. Then I remix the groups and they create zonal averages of these data at particular longitudes (like Fig. 2-14 in Ruddiman, "Earth's Climate: Past & Future").
(Note: this resource was added to OER Commons as part of a batch upload of over 2,200 records. If you notice an issue with the quality of the metadata, please let us know by using the 'report' button and we will flag it for consideration.)
After conducting an assessment that showed their buildings vulnerability to wind damage, …
After conducting an assessment that showed their buildings vulnerability to wind damage, the Nicklaus Childrens Hospital in Miami looked for a way to improve safety for patients and staff.
Scientists predict that hurricanes will hit us harder in the future -- …
Scientists predict that hurricanes will hit us harder in the future -- but why? And what can we expect to see? In this episode of #TILclimate (Today I Learned: Climate), MIT professor Kerry Emanuel joins host Laur Hesse Fisher to break down how these “heat engines” work and how a changing climate will increase hurricane intensity, storm surges, and flooding. They also explore how people around the world are adapting to growing hurricane risks.
A Severe Weather interactive lesson with 51 slides that can be published …
A Severe Weather interactive lesson with 51 slides that can be published for students to complete independently on any teaching platform using Google Drive.
No restrictions on your remixing, redistributing, or making derivative works. Give credit to the author, as required.
Your remixing, redistributing, or making derivatives works comes with some restrictions, including how it is shared.
Your redistributing comes with some restrictions. Do not remix or make derivative works.
Most restrictive license type. Prohibits most uses, sharing, and any changes.
Copyrighted materials, available under Fair Use and the TEACH Act for US-based educators, or other custom arrangements. Go to the resource provider to see their individual restrictions.