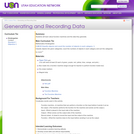
Students will analyze and compare census data on the education levels of …
Students will analyze and compare census data on the education levels of African-Americans in 1850 and in 1880. Students will also discuss how historical events can affect data.
Students will examine how human actions and population changes can affect the …
Students will examine how human actions and population changes can affect the environment. Students will examine a series of photographs that compare famous landmarks (Times Square, the Saltair Pavilion in Utah, Laguna Beach, and Niagara Falls) across time, and then they will identify human-generated changes in the physical environment, such as the addition of bridges and roads. Students will also examine U.S. Census Bureau population and housing data to see how population changes can contribute to changes in the physical environment. In addition, students will describe the impact of these changes on the environment.
Students will examine historical photographs and a data table related to 19th-century …
Students will examine historical photographs and a data table related to 19th-century industrialization and child labor. They will observe and analyze the primary sources and ask questions. This activity could be used near the beginning of a unit on industrialization or the Progressives.
Students conduct an experiment to study the acceleration of a mobile Android …
Students conduct an experiment to study the acceleration of a mobile Android device. During the experiment, they run an application created with MIT's App Inventor that monitors linear acceleration in one-dimension. Students use an acceleration vs. time equation to construct an approximate velocity vs. time graph. Students will understand the relationship between the object's mass and acceleration and how that relates to the force applied to the object, which is Newton's second law of motion.
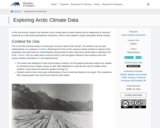
In this activity, students use authentic Arctic climate data to explore albedo …
In this activity, students use authentic Arctic climate data to explore albedo and its relationship to seasonal snowmelt as a self-reinforcing feedback mechanism, which is then applied to large scale global climate change.
Exploring Computer Science is a yearlong course developed around a framework of …
Exploring Computer Science is a yearlong course developed around a framework of both computer science content and computational practice. Assignments and instruction are contextualized to be socially relevant and meaningful for diverse students. Units utilize a variety of tools/platforms and culminate with final projects around Human-Computer Interaction, Problem Solving, Web Design (HTML, CSS), Programming (Scratch, Edware), Computing & Data Analysis, and Robotics. ECS is recognized nationally as a preparatory course for AP Computer Science Principles. Watch this video and view this fact sheet for more information.
These resources were created to compliment our undergraduate statistics lab manual, Applied …
These resources were created to compliment our undergraduate statistics lab manual, Applied Data Analysis in Psychology: Exploring Diversity with Statistics, published by Kendall Hunt publishing company. Like our lab manual, these JASP walk-through guides meaningfully and purposefully integrate and highlight diversity research to teach students how to analyze data in an open-source statistical program. The data sets utilized in these guides are from open-access databases (e.g., Pew Research Center, PLoS One, ICPSR, and more). Guides with step-by-step instructions, including annotated images and examples of how to report findings in APA format, are included for the following statistical tests: independent samples t test, paired samples t test, one-way ANOVA, two factor ANOVA, chi-square test, Pearson correlation, simple regression, and multiple regression.
This set of assignments exposes students to data which can be used …
This set of assignments exposes students to data which can be used to analyze economic inequality in international and historical context. Then students are asked to generate a thesis-driven argument drawing supporting evidence from one or more of the data sources.
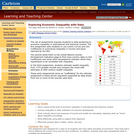
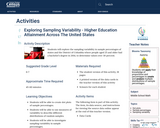
Students will explore the sampling variability in sample percentages of states and …
Students will explore the sampling variability in sample percentages of states and the District of Columbia where people aged 25 and older had a bachelor’s degree in 2014, to determine values over 30 percent.
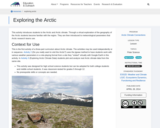
This activity introduces students to the Arctic and Arctic climate. Through a …
This activity introduces students to the Arctic and Arctic climate. Through a virtual exploration of the geography of the Arctic students become familiar with the region. They are then introduced to meteorological parameters that Arctic research teams use.
This unit integrates a series of lessons on justice system based on …
This unit integrates a series of lessons on justice system based on given statistical facts. The essential question of the unit is: How can complex text and statistical numbers assist in illustrating the truth of our justice system? In Illustrating the truth through powerful colorful graphs that accentuate the statistics hidden in the text and illustrate facts in a dynamic form.
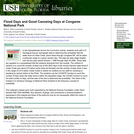
SSAC Geology of National Parks module/Geology of National Parks course. Students calculate …
SSAC Geology of National Parks module/Geology of National Parks course. Students calculate probabilities using USGS hydrograph data, a spreadsheet of daily stage heights, and the COUNTIF function.
This video lesson is an example of ''teaching for understanding'' in lieu …
This video lesson is an example of ''teaching for understanding'' in lieu of providing students with formulas for determining the height of a dropped (or projected) object at any time during its fall. The concept presented here of creating a chart to organize and analyze data collected in a simple experiment is broadly useful. During the classroom breaks in this video, students will enjoy timing objects in free fall and balls rolling down ramps as a way of learning how to carefully conduct experiments and analyze the results. The beauty of this lesson is the simplicity of using only the time it takes for an object dropped from a measured height to strike the ground. There are no math prerequisites for this lesson and no needed supplies, other than a blackboard and chalk. It can be completed in one 50-60-minute classroom period.
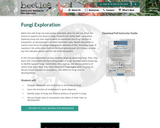
Weird and wild fungi are everywhere, especially when it’s wet out. Given …
Weird and wild fungi are everywhere, especially when it’s wet out. Given the chance to explore and observe fungi, students will notice them everywhere. Exploring fungi will also lead students to appreciate how fungi function in ecosystems as decomposers and other important roles. Recent discoveries in science have found that huge underground networks of thin, branching tubes of mycelium, the white tubes that are the main growing part of a fungus, provide key links between plants and the rest of the ecosystem.
In this Focused Exploration activity, students begin by observing fungi. Then, they learn that mushrooms are the fruiting bodies of fungi. Students use a simple key to identify types of fungi, record data, then regroup, and discuss patterns of where fungi grow. Next, they learn about how fungi digest what they live on, discuss fungal impacts on ecosystems, and reflect on fungi roles in decomposition.
In this open-ended, hands-on activity that provides practice in engineering data analysis, …
In this open-ended, hands-on activity that provides practice in engineering data analysis, students are given gait signature metric (GSM) data for known people types (adults and children). Working in teams, they analyze the data and develop models that they believe represent the data. They test their models against similar, but unknown (to the students) data to see how accurate their models are in predicting adult vs. child human subjects given known GSM data. They manipulate and graph data in Excel® to conduct their analyses.
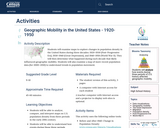
Students will examine maps to explore changes in population density in the …
Students will examine maps to explore changes in population density in the United States during three decades: 1920–1930 (Post-Progressive Era), 1930–1940 (Great Depression), and 1940–1950 (World War II). They will then determine what happened during each decade that likely influenced geographic mobility. Students will also examine a map of more recent population data (for 2000–2010) to understand trends in population movement.
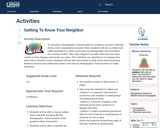
To introduce demographic characteristics to students, teachers will help them create a …
To introduce demographic characteristics to students, teachers will help them create a population pyramid. Then, students will use an online tool called QuickFacts to find census data on demographic characteristics for a county in 2017. They will compare it to older data from the same county to find changes and trends over time. They will then use QuickFacts to examine data about their school’s county. Students will use this information to help them understand how business owners and community leaders use data on demographic characteristics to make decisions.
Gingerbread men and gingerbread houses enjoy special popularity around the holidays, but …
Gingerbread men and gingerbread houses enjoy special popularity around the holidays, but many of these gingerbread activities are timeless and complement literature titles that teachers use at the beginning of school or after the holidays. It's very easy to incorporate mathematics into a study of gingerbread men, and students will enjoy the data collection activities and games while learning math skills and deepening their understanding of important mathematical concepts. Look through these math activities and add some to your repertoire. Consider broadening the gingerbread math to include measurement, games and problem solving this year.
No restrictions on your remixing, redistributing, or making derivative works. Give credit to the author, as required.
Your remixing, redistributing, or making derivatives works comes with some restrictions, including how it is shared.
Your redistributing comes with some restrictions. Do not remix or make derivative works.
Most restrictive license type. Prohibits most uses, sharing, and any changes.
Copyrighted materials, available under Fair Use and the TEACH Act for US-based educators, or other custom arrangements. Go to the resource provider to see their individual restrictions.