Word Count: 19741 (Note: This resource's metadata has been created automatically by …
Word Count: 19741
(Note: This resource's metadata has been created automatically by reformatting and/or combining the information that the author initially provided as part of a bulk import process.)
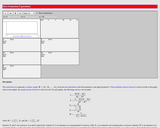
This is an Excel spreadsheet and graph that illustrates standard "batch" and …
This is an Excel spreadsheet and graph that illustrates standard "batch" and Rayleigh decarbonation models and how they can be used to detect fluid infiltration during metamorphism of carbonates. It makes a good lecture demonstration, but with a few modifications can be turned into a laboratory exercise. Key variables are "hotlinked" directly into the batch and Rayleigh models so students can adjust them to get a feel for the influence of different model parameters. The included carbon isotope data are from marbles in the Jervois region, central Australia (Cartwright et al., 1997). Oxygen isotope data are also included in the spreadsheet.
(Note: this resource was added to OER Commons as part of a batch upload of over 2,200 records. If you notice an issue with the quality of the metadata, please let us know by using the 'report' button and we will flag it for consideration.)
Students are given the task of predicting where parasequence boundaries would exist …
Students are given the task of predicting where parasequence boundaries would exist within a vertical section of the Blackhawk Formation, Utah. This activity challenges students to apply their knowledge of bedforms in order to interpret the facies they observe. The students work in groups of two as they make their observations. The vertical section consists of four main outcrops to be observed by the students. After making their observations and interpretations of these four outcrops, the students then make predictions of what should be found up section. Students begin down section by observing the lowest section of the four outcrops. The students make observations about lithology, grain size, sedimentary structures and trace fossils. After recording their observations in their field notebook the class gathers for a discussion. Students are called on randomly to discuss what they observed. The class creates a group stratigraphic column on a white board and includes their observations to the right of the drawn profile. They are then asked to interpret what facies these observations represent. The students defend their interpretations and, as a group, agree upon an interpretation. The facies interpretation is then added to the white board and the group moves to the next outcrop up section. After observing, describing and interpreting each of the four outcrops the students are challenged to use all of the information gathered thus far to predict what facies should be observed further up section. This exercise provides an opportunity for the students to make and defend observations and interpretations. They also get a sense for the importance of Walther's Law and how it relates to sequence stratigraphy.
(Note: this resource was added to OER Commons as part of a batch upload of over 2,200 records. If you notice an issue with the quality of the metadata, please let us know by using the 'report' button and we will flag it for consideration.)
An unintimidating guide to basic hypothesis testing logic for beginners Word Count: …
An unintimidating guide to basic hypothesis testing logic for beginners
Word Count: 45834
(Note: This resource's metadata has been created automatically by reformatting and/or combining the information that the author initially provided as part of a bulk import process.)
Apply the sampling distribution of the sample mean as summarized by the …
Apply the sampling distribution of the sample mean as summarized by the Central Limit Theorem (when appropriate). In particular, be able to identify unusual samples from a given population.
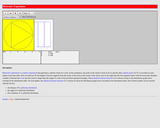
This resource consists of a Java applet and expository text. The applet …
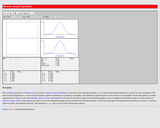
This resource consists of a Java applet and expository text. The applet is a simulation of Bertrand's experiment: a random chord on a circle The event of interest is whether the length of the chord is larger than the length of the inscribed equilateral triangle. Three models for generating the random chord can be used.
This resource consists of a Java applet and expository text. The applet …
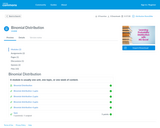
This resource consists of a Java applet and expository text. The applet illustrates Bayesian estimation of the probability of heads for a coin. The prior beta distribution, true probability of heads, and the sample size can be specified. The applet shows the posterior beta distribution.
This resource consists of a Java applet and expository text. The applet …
This resource consists of a Java applet and expository text. The applet simulates a random sample from a beta distribution, and computes standard point estimates of the left and right parameters. The bias and mean square error are also computed.
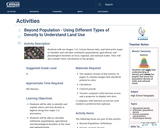
Students will use images, U.S. Census Bureau data, and interactive maps to …
Students will use images, U.S. Census Bureau data, and interactive maps to visualize and calculate arithmetic (population), agricultural, and physiological densities at local, regional, and national scales. They will also transfer their calculations to bar graphs.
Students act as R&D entrepreneurs, learning ways to research variables affecting the …
Students act as R&D entrepreneurs, learning ways to research variables affecting the market of their proposed (hypothetical) products. They learn how to obtain numeric data using a variety of Internet tools and resources, sort and analyze the data using Excel and other software, and discover patterns and relationships that influence and guide decisions related to launching their products. First, student pairs research and collect pertinent consumer data, importing the data into spreadsheets. Then they clean, organize, chart and analyze the data to inform their product production and marketing plans. They calculate related statistics and gain proficiency in obtaining and finding relationships between variables, which is important in the work of engineers as well as for general technical literacy and decision-making. They summarize their work by suggesting product launch strategies and reporting their findings and conclusions in class presentations. A finding data tips handout, project/presentation grading rubric and alternative self-guided activity worksheet are provided. This activity is ideal for a high school statistics class.
Short Description: The book includes details on how to analyze public-use data …
Short Description: The book includes details on how to analyze public-use data from five common national health surveys using SAS statistical software. It is an essential resource for future epidemiologists and other public health professionals!
Long Description: National data sets provide an avenue for students to practice data analytic skills while also answering meaningful research questions. This open education resource was developed to train future public health professionals how to conduct secondary data analysis of national health surveys using SAS statistical software. SAS software was selected because it is one of the most commonly used software programs used among public health departments and academia. The book includes details on how to analyze public-use data from five common national health surveys, including the National Health Interview Survey (NHIS), Medical Expenditure Panel Survey (MEPS), Health Information National Trends Survey (HINTS), Behavior Risk Factor Surveillance System (BRFSS) and National Health and Nutrition and Examination Survey (NHANES). All datasets and corresponding syntax files are available from the Open ICPSR Data Repository.
Word Count: 43537
ISBN: 978-1-64816-003-5
(Note: This resource's metadata has been created automatically by reformatting and/or combining the information that the author initially provided as part of a bulk import process.)
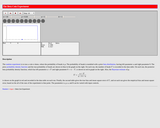
This resource consists of a Java applet and expository text. The applet …
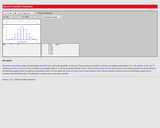
This resource consists of a Java applet and expository text. The applet simulates Bernoulli trials in terms of random points on a timeline. The random variables of interest are the number of successes and the proportion of successes. The number of trials and the probability of success can be varied. This applet illustrates the law of large numbers, the central limit theorem, and the binomial distribution.
This textbook provides a survey of statistical methods commonly used in the …
This textbook provides a survey of statistical methods commonly used in the life sciences, an introduction to statistical theory, and significant exposure to the statistical software package SAS 9.4. The textbook is designed for graduate students and upper division undergraduates, and assumes some familiarity with mathematical notation, functions, and algebra. No previous courses in statistics are needed. For those interested in using the software package R, programs similar in function to the SAS ones are also provided. A unique feature of this textbook is the integration of statistical procedures and theory. Most introductory texts present the statistical procedures and a mechanistic explanation of how they work, without discussing the underlying theory. Some knowledge of this theory is essential for students in the life sciences, especially graduate students, and so the textbook uses likelihood theory to explain how parameters are estimated and statistical tests derived. The statistical models for ANOVA, regression, and other common procedures are also presented. These theoretical concepts are presented in both equation and graphical form. For detailed information on the topics covered in this textbook, see the Table of Contents file in Section 1.
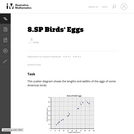
This task asks students to glean contextual information about bird eggs from …
This task asks students to glean contextual information about bird eggs from a collection of measurements of said eggs organized in a scatter plot. In particular, students are asked to identify a correlation and use it to make interpolative predictions, and reason about the properties of specific eggs via the graphical presentation of the data.
This resource consists of a Java applet and expository text. The applet …
This resource consists of a Java applet and expository text. The applet simulates the bivariate normal distribution. The means are set at 0, but the standard deviations and the correlation can be varied. Simulated points from the distribution are shown as dots in a scatterplot.
This resource consists of a Java applet and expository text. The Java …
This resource consists of a Java applet and expository text. The Java applet illustrates the bivariate uniform distribution on three types of regions: a square, a circle, and a triangle. Simulated points from the distribution are shown as dots in a scatterplot.
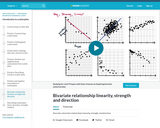
Describe a bivariate relationship's linearity, strength, and direction. In other words, plotting …
Describe a bivariate relationship's linearity, strength, and direction. In other words, plotting things that take two variables into consideration and trying to see whether there's a pattern with how they relate.
Storms can have devastating impacts on coastal communities. Typically, tropical storms like …
Storms can have devastating impacts on coastal communities. Typically, tropical storms like hurricanes get the most attention, but there are other types of storms that occur at more northern latitudes that can be just as destructive. For example, in January of 2018, Winter Storm Grayson caused more than 300,000 power outages and $1.1 billion in damage, and resulted in 22 confirmed casualties along the eastern seaboard. In this module, students will learn how barometric pressure changes during a storm, analyze the effect of storms on oceanographic variables, classify a storm as a bomb cyclone, and compare a bomb cyclone to a hurricane. Ultimately students will use their quantitative reasoning skills to manipulate and visualize data during storms in the northeastern United States.
(Note: this resource was added to OER Commons as part of a batch upload of over 2,200 records. If you notice an issue with the quality of the metadata, please let us know by using the 'report' button and we will flag it for consideration.)
No restrictions on your remixing, redistributing, or making derivative works. Give credit to the author, as required.
Your remixing, redistributing, or making derivatives works comes with some restrictions, including how it is shared.
Your redistributing comes with some restrictions. Do not remix or make derivative works.
Most restrictive license type. Prohibits most uses, sharing, and any changes.
Copyrighted materials, available under Fair Use and the TEACH Act for US-based educators, or other custom arrangements. Go to the resource provider to see their individual restrictions.