This course covers the complete cycle of designing an ocean system using …
This course covers the complete cycle of designing an ocean system using computational design tools for the conceptual and preliminary design stages. Students complete the projects in teams with each student responsible for a specific subsystem. Lectures cover such topics as hydrodynamics; structures; power and thermal aspects of ocean vehicles; environment, materials, and construction for ocean use; and generation and evaluation of design alternatives. The course focuses on innovative design concepts chosen from high-speed ships, submersibles, autonomous vehicles, and floating and submerged deep-water offshore platforms. Lectures on ethics in engineering practice are included, and instruction and practice in oral and written communication is provided.
This resource is a video abstract of a research paper created by …
This resource is a video abstract of a research paper created by Research Square on behalf of its authors. It provides a synopsis that's easy to understand, and can be used to introduce the topics it covers to students, researchers, and the general public. The video's transcript is also provided in full, with a portion provided below for preview:
"Biodiversity keeps our planet stable. Each species, no matter how small, plays an important role in this global balancing act. That’s why the current pace of biodiversity loss is so alarming. Unfortunately, slowing that pace is extremely difficult. Scientists must first take on the virtually impossible task of measuring the richness and variety of all life on earth—the tools for which are prone to error. Now, researchers have applied a technique that promises estimates that more closely reflect true biodiversity. Proven insightful for stony coral species found throughout the world, the approach could potentially be extended to other animals and plants. Researchers typically use two types of methods to measure biodiversity: by consulting occurrence datasets, which describe points where species have been physically counted, or by combining maps describing geographical ranges where a species is predicted to occur. Each has its own drawbacks. Occurrence datasets tend to be incomplete..."
The rest of the transcript, along with a link to the research itself, is available on the resource itself.
In this project, students perform library research on an assigned marine animal, …
In this project, students perform library research on an assigned marine animal, create a formatted poster of their topic, and share with their classmates what they've learned in a poster session, conducted in the way of poster sessions at science conferences. Afterward, students complete a written assignment where they are asked to reflect on their experience as a participant in a community of science students, their focused learning on their own marine animal, their larger learning about the diversity of marine life from their poster session participation, and what it implies about the intrinsic value of the ocean realm, and the need for conservation. The outcomes for this assignment are aligned with course-specific outcomes articulated in the Minnesota Transfer Curriculum. They are:
Synthesize central concepts from assigned readings of scientific literature in written assignments. Discuss/compare characteristics of diverse environments in the context of ocean science. Interpret data generated by oceanographic techniques, and present written and oral summaries of their findings. Explain the basic structure and function of the ocean realm, the impact of humans on it, and the impact of the ocean realm on humans.
(Note: this resource was added to OER Commons as part of a batch upload of over 2,200 records. If you notice an issue with the quality of the metadata, please let us know by using the 'report' button and we will flag it for consideration.)
Introduction to dynamics and vibration of lumped-parameter models of mechanical systems. Three-dimensional …
Introduction to dynamics and vibration of lumped-parameter models of mechanical systems. Three-dimensional particle kinematics. Force-momentum formulation for systems of particles and for rigid bodies (direct method). Newton-Euler equations. Work-energy (variational) formulation for systems particles and for rigid bodies (indirect method). Virtual displacements and work. Lagrange's equations for systems of particles and for rigid bodies. Linearization of equations of motion. Linear stability analysis of mechanical systems. Free and forced vibration of linear damped lumped parameter multi-degree of freedom models of mechanical systems. Application to the design of ocean and civil engineering structures such as tension leg platforms. This subject was originally offered in Course 13 (Department of Ocean Engineering) as 13.013J. In 2005, ocean engineering became part of Course 2 (Department of Mechanical Engineering), and this subject merged with 2.003.
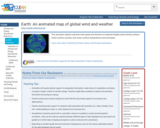
This animation depicts real-time wind speed and direction at selected heights above …
This animation depicts real-time wind speed and direction at selected heights above Earth's surface, ocean surface currents, and ocean surface temperatures and anomalies.
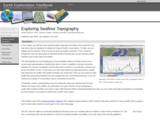
DATA: Digital Elevation Model Data. TOOL: GeoMapApp. SUMMARY: Explore a timeline about …
DATA: Digital Elevation Model Data. TOOL: GeoMapApp. SUMMARY: Explore a timeline about how we have learned about the oceans. Construct a profile across the Atlantic Ocean and create 3-D visualizations of the seafloor.
(Note: this resource was added to OER Commons as part of a batch upload of over 2,200 records. If you notice an issue with the quality of the metadata, please let us know by using the 'report' button and we will flag it for consideration.)
This short video uses animated imagery from satellite remote sensing systems to …
This short video uses animated imagery from satellite remote sensing systems to illustrate that Earth is a complex, evolving body characterized by ceaseless change. Adapted from NASA, this visualization helps explain why understanding Earth as an integrated system of components and processes is essential to science education.
Our planet is becoming hot. In fact, Earth may be warming faster …
Our planet is becoming hot. In fact, Earth may be warming faster than ever before. This warming will challenge society throughout the 21st century. How do we cope with rising seas? How will we prepare for more intense hurricanes? How will we adapt to debilitating droughts and heat waves? Scientists are striving to improve predictions of how the environment will change and how it will impact humans. Earth in the Future: Predicting Climate Change and Its Impacts Over the Next Century is designed to provide the state of the art of climate science, the impact of warming on humans, as well as ways we can adapt. Every student will understand the challenges and opportunities of living in the 21st century.
Hands-on laboratory activity that allows students to investigate the effects of distance …
Hands-on laboratory activity that allows students to investigate the effects of distance and angle on the input of solar radiation at Earth's surface, the role played by albedo, the heat capacity of land and water, and how these cause the seasons. Students predict radiative heating based on simple geometry and experiment to test their hypotheses.
Individual project designed to combine basic oceanographic concepts in the creation of …
Individual project designed to combine basic oceanographic concepts in the creation of a travel brochure. Involves some group interaction, but project is individual. Can be done online or in a face-to-face class. Best completed at midterm or later in the semester so that most concepts have been introduced.
LEARNING OUTCOMES
Describe major oceanic processes and evaluate their influence on the coastal environment. 2Use global data on climate and wind patterns to quantify and describe conditions at various specific coastal sites.
(Note: this resource was added to OER Commons as part of a batch upload of over 2,200 records. If you notice an issue with the quality of the metadata, please let us know by using the 'report' button and we will flag it for consideration.)
This video shows 15 years of data obtained via Polar-orbiting satellites that …
This video shows 15 years of data obtained via Polar-orbiting satellites that are able to detect subtle differences in ocean color, allowing scientists to see where there are higher concentrations of phytoplankton - a proxy for the concentration of chlorophyll in the ocean.
This activity investigates the oceanographic and climatic characteristics of El NiÃo/La NiÃa …
This activity investigates the oceanographic and climatic characteristics of El NiÃo/La NiÃa (ENSO) events using observational data from moored ocean buoys in the tropical Pacific Ocean. Data are obtained from NOAA's Tropical Atmosphere Ocean (TAO) project website which provides a web-based interface for accessing and displaying oceanographic data. In addition to providing an introduction to ENSO, this activity is designed to give students practice interpreting real oceanographic observations by emphasizing the description and identification of patterns in large data-sets. Students first describe patterns in sea-surface and cross-sectional transects of ocean temperatures and surface winds associated with "normal", El NiÃo, and La NiÃa years and then use this as a basis for classifying observations from unknown years and interpreting connections between oceanographic and atmospheric processes occurring in the tropical Pacific.
(Note: this resource was added to OER Commons as part of a batch upload of over 2,200 records. If you notice an issue with the quality of the metadata, please let us know by using the 'report' button and we will flag it for consideration.)
This is a field and computer laboratory exercise that introduces undergraduate students, …
This is a field and computer laboratory exercise that introduces undergraduate students, advanced high school students, and members of the general public to using Google Earth, GPS, aerial imagery, and an online illustrated vegetation and tidal marsh environment identification guide to distinguish and map vegetational and physical environmental zones within a salt marsh. They also learn about the physical and ecological relationships between these environments.
Students use GPS devices to collect field data as waypoints and tracks, and upload the data to computers in GPX format. They learn to open the data in Google Earth along with infrared and color aerial imagery, and use the GPS data to interpret the aerial imagery. Using Google Earth tools, they draw polygons to demarcate the boundaries of environmental zones in the wetlands that they recognize on the imagery.
The students and instructors also take photographs of the students in each of these environmental zones and embed the photographs into information balloons of placemarks in Google Earth.
The exercise was originally designed for use at Flax Pond, a salt marsh on the North Shore of Long Island. However, it can easily be adapted for use in other tidal marshes, and can serve as a template for developing similar activities to be conducted at other locations in which aerial imagery can be used to distinguish various forms of land cover.
(Note: this resource was added to OER Commons as part of a batch upload of over 2,200 records. If you notice an issue with the quality of the metadata, please let us know by using the 'report' button and we will flag it for consideration.)
Students cooperatively conduct original research in Marine Geology utilizing marine practices on …
Students cooperatively conduct original research in Marine Geology utilizing marine practices on Lake Champlain, NY - Vermont. The lab section of the course is used to develop and implement a research project. The students are given a research question to solve. To proceed, they must first review all available literature and then design a research program. They then implement that program using marine and laboratory equipment that is available to them and report on their outcomes after a semester-long investigation.
(Note: this resource was added to OER Commons as part of a batch upload of over 2,200 records. If you notice an issue with the quality of the metadata, please let us know by using the 'report' button and we will flag it for consideration.)
The year is 2050 and your once-idyllic beachfront vacation home is now …
The year is 2050 and your once-idyllic beachfront vacation home is now flooded up to the second story. The crab your family has enjoyed every Christmas for as long as you can remember has now become an endangered species. The oceans have changed. In Earth 540, Oceanography for Educators, we explore the mechanisms that lead to sea level rise and ocean acidification. We strive to understand how natural processes such as ocean currents, the gulf-stream, tides, plate tectonics, and the Coriolis Effect, affect our oceans and ocean basins. We then predict how man-made issues such as climate change and overfishing will affect our beloved waters and our livelihoods. Want to see into the future? Then this course is for you!
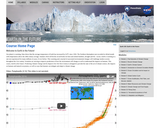
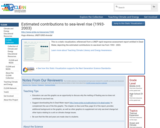
This is a static visualization, referenced from a UNEP rapid response assessment …
This is a static visualization, referenced from a UNEP rapid response assessment report entitled In Dead Water, depicting the estimated contributions to sea-level rise from 1993 - 2003.
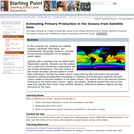
In this computer lab, students use satellite imagery, daylength information, and phytoplankton …
In this computer lab, students use satellite imagery, daylength information, and phytoplankton physiology models to calculate annual primary production for an assigned ocean region.
Satellite data is obtained from the NASA Earth Observation website. Students use the analysis tool to determine chlorophyll concentration and sea surface temperature. They also receive a day-length calculator and are asked to model light transmission through the water column. Using step-by-step instructions and proviede equations relating phytoplankton physiology to irradiance and temperature students calculate carbon uptake at discreet locations in the water column. The second half of the exercise involves scaling up to the entire water column, region, and season. Students present their work to the class and evaluate their result using scientific literature. Differences between regions are then discussed by the class.
(Note: this resource was added to OER Commons as part of a batch upload of over 2,200 records. If you notice an issue with the quality of the metadata, please let us know by using the 'report' button and we will flag it for consideration.)
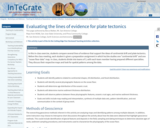
In this in-class exercise, students compare several lines of evidence that support …
In this in-class exercise, students compare several lines of evidence that support the ideas of continental drift and plate tectonics. Before the class meeting, each student is given a preparation assignment in which he/she studies one "continental drift" and one "ocean floor data" map. In class, students divide into teams of 3, with each team member having prepared different specialties. They discuss their respective maps and look for spatial patterns among the data.
(Note: this resource was added to OER Commons as part of a batch upload of over 2,200 records. If you notice an issue with the quality of the metadata, please let us know by using the 'report' button and we will flag it for consideration.)
No restrictions on your remixing, redistributing, or making derivative works. Give credit to the author, as required.
Your remixing, redistributing, or making derivatives works comes with some restrictions, including how it is shared.
Your redistributing comes with some restrictions. Do not remix or make derivative works.
Most restrictive license type. Prohibits most uses, sharing, and any changes.
Copyrighted materials, available under Fair Use and the TEACH Act for US-based educators, or other custom arrangements. Go to the resource provider to see their individual restrictions.