In association with rock and mineral ID tables, this lab introduces students …
In association with rock and mineral ID tables, this lab introduces students to basic rocks and minerals via grouping and comparison, rather than as individual samples. I use this lab in my environmental geology course, where we don't have enough lab time to examine each set of rocks and minerals separately, but students need a basic familiarity with these materials and a context in which to place them. I find these groupings teach them how to look at rocks and minerals and give them the cursory experience identifying geologic materials necessary to go on successfully in the course.
(Note: this resource was added to OER Commons as part of a batch upload of over 2,200 records. If you notice an issue with the quality of the metadata, please let us know by using the 'report' button and we will flag it for consideration.)
This activity involves building crystal structure ball models in order to strengthen …
This activity involves building crystal structure ball models in order to strengthen students' understanding of crystalline order, relative atomic size, atomic coordination, crystal chemistry, and crystal symmetry.
(Note: this resource was added to OER Commons as part of a batch upload of over 2,200 records. If you notice an issue with the quality of the metadata, please let us know by using the 'report' button and we will flag it for consideration.)
Facies models are often abstract and difficult for undergraduate students to fully …
Facies models are often abstract and difficult for undergraduate students to fully understand. As a result, they tend to memorize idealized diagrams from text books that can be reproduced for an exam, then forgotten.
The purpose of this exercise is to help students understand a model by "building" it "piece by piece" and relating the various components to concepts they learned earlier in the semester, such as energy relationships, base level, facies, facies associations, and Walther's Law. It is designed to begin as an in-class discussion led by the instructor using a black or white board, followed by group collaboration, out-of-class exercises, and concluding with a formal examination.
The example provided here is for a prograding shoreface system; however, the same approach can be applied to any depositional system.
The purpose of this exercise is to guide students through the process …
The purpose of this exercise is to guide students through the process of constructing a stratigraphic sequence based on understanding relationships between the production of space and filling that space with sediment.
In this activity, students look at how sediments compact as they are …
In this activity, students look at how sediments compact as they are buried in a subduction zone and explore how rapid burial can lead to increased water pressure.
(Note: this resource was added to OER Commons as part of a batch upload of over 2,200 records. If you notice an issue with the quality of the metadata, please let us know by using the 'report' button and we will flag it for consideration.)
In this lab exercise, students examine one or more metamorphic rocks and …
In this lab exercise, students examine one or more metamorphic rocks and use various approaches to estimating and calculating the pressure-temperature conditions at which the rocks equilibrated. The exercise involves hand sample description, petrography, interpretation of phase diagrams, and calculations of a phase diagram or P-T conditions from given equations.
An activity where students make a geologic timeline from calculator tape. (Note: …
An activity where students make a geologic timeline from calculator tape.
(Note: this resource was added to OER Commons as part of a batch upload of over 2,200 records. If you notice an issue with the quality of the metadata, please let us know by using the 'report' button and we will flag it for consideration.)
Reading and constructing geologic maps is one skill that every geologists has …
Reading and constructing geologic maps is one skill that every geologists has to master. Initially, this means that we have to understand the symbols that are used on geologic maps. Once we know the general meaning of these symbols, we will have to learn how to measure and plot them. The measuring is generally done using a magnetic compass. Finally, we have to plot the data on a map so that others understand the geology based on our mapping.
(Note: this resource was added to OER Commons as part of a batch upload of over 2,200 records. If you notice an issue with the quality of the metadata, please let us know by using the 'report' button and we will flag it for consideration.)
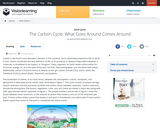
This module provides an overview of the biogeochemical carbon cycle. Major sources …
This module provides an overview of the biogeochemical carbon cycle. Major sources and sinks of carbon are discussed as well as the impact of human activities on global carbon levels.
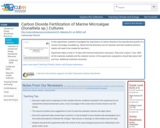
In this experiment, students investigate the importance of carbon dioxide to the …
In this experiment, students investigate the importance of carbon dioxide to the reproductive growth of a marine microalga, Dunalliela sp. (Note that the directions are for teachers and that students protocol sheets will need to be created by teachers.)
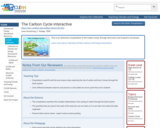
Interactive visualization that provides a basic overview of the Earth's carbon reservoirs …
Interactive visualization that provides a basic overview of the Earth's carbon reservoirs and amount of carbon stored in each, CO2 transport among atmosphere, hydrosphere, geosphere, and biosphere, and a graph comparing global temp (deg C) and atmospheric CO2 levels (ppm) over the past 1000 years.
Students collect and analyze geological and biological materials for carbon content in …
Students collect and analyze geological and biological materials for carbon content in order to investigate carbon through time. Implications for energy production now and in the future are explored in the context of carbon cycling in the oceans, the atmosphere, and the geosphere.
In this 3-part lab activity, students investigate how carbon moves through the …
In this 3-part lab activity, students investigate how carbon moves through the global carbon cycle and study the effects of specific feedback loops on the carbon cycle.
This case study is an examination of the chemical and sensory impacts …
This case study is an examination of the chemical and sensory impacts of a variety of environmental issues including sand mining, leaking underground gasoline storage tanks (LUSTs), and a railroad.
Wedron is a small, unincorporated town of approximately 100 residents in north central Illinois. A large sand mine has been in operation on the south and west sides of the town for many decades, and the mine property includes several abandoned and active pits, a processing plant, and a train car loading facility. Railroad tracks are located along the east side of town as is a grain elevator (storage and loading facility).
The following information was obtained from the US EPA web site about Wedron, personal visits to the town, and published news articles.
This case study includes discussion questions and data sources for further information.
(Note: this resource was added to OER Commons as part of a batch upload of over 2,200 records. If you notice an issue with the quality of the metadata, please let us know by using the 'report' button and we will flag it for consideration.)
Two or three weeks of the course are dedicated to studying diagenesis. …
Two or three weeks of the course are dedicated to studying diagenesis. Lectures start with a general definition of diagenesis, the range of conditions under which it occurs, and examples of diverse diagenetic environments and features. I use rice crispy cereal and rice crispy treats to introduce cement (the marshmellow is the cement that "glues" the rice krispies together). I also incorporate basic hydrogeology to show how pores filled with (or partially filled with) groundwater provide both the space and the material for cementation. As part of this lecture, I show the students various rock samples and photomicrographs in which they can see cement examples. I outline the different cement minerals and shapes and how they can be used to interpret past diagenetic conditions (eg., gravitational "pendant" calcite cements indicate that the host sediment was once in a vadose zone with groundwater rich in calcium and carbonate). I also discuss types of pores during these lectures and the ways that pores form. We also discuss criteria for recognizing cements. After two one-hour lectures about cements, we have a lab exercise in which the students are given ~10 samples (including hand samples and thin sections) and asked to sketch and describe the cement types. The next one-hour lecture focuses on neomorphic processes and their products, including replacement, recrystallization, and polymorphic transition. As part of the lecture, we look at photomicrographs and hand samples that illstrate various neomorphic features, such as replacement dolomite and replacement chert. We establish criteria for distinguishing cements from neomorphic fabrics. This lecture is followed by a lab exercise that presents the students with ~10 rocks and thin sections and asks them to sketch and identify neomorphic fabrics. This lab is follwed by another one-hour lecture on compaction features, dissolution evidence, and determining paragentic sequences. If I am short on time, that is all I do for diagenesis. However, ideally, I continue with a lecture focused on the "dolomite problem" and some case studies of other types of diagenesis, as well as a third lab assignment that combines cementation, neomorphism, compaction, dissolution, and paragenetic sequences. As part of this section, I also try to incorporate examples of methods other than petrology (eg., fluid inclusion studies, stable isotope studies, dating) that are used for diagenetic studies. Later in the course, we take several field trips in which the students examine diagenetic features.
(Note: this resource was added to OER Commons as part of a batch upload of over 2,200 records. If you notice an issue with the quality of the metadata, please let us know by using the 'report' button and we will flag it for consideration.)
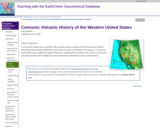
In this activity, students view a Quicktime video animation based on data …
In this activity, students view a Quicktime video animation based on data from the North American Volcanic and Intrusive Rock Database (NAVDAT) to learn about the history of volcanism in the western U.S. during the last 65 million years. Students are guided through the complex data-rich animation with a series of instructions and study questions which highlight time-space-composition relationships and link to plate tectonics.
(Note: this resource was added to OER Commons as part of a batch upload of over 2,200 records. If you notice an issue with the quality of the metadata, please let us know by using the 'report' button and we will flag it for consideration.)
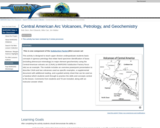
This module teaches basic concepts in igneous petrology through relating hand specimen …
This module teaches basic concepts in igneous petrology through relating hand specimen identification of lavas to major element geochemistry, using the Central American volcanic arc as an example.
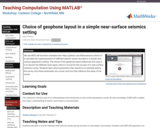
Click to watch Alain Plattner discuss his activity or watch the full webinar.We use MATLAB functions available from https://github.com/NSGeophysics/Seism-O to simulate the superimposition of different seismic waves recorded in a simple near-surface geophysics setting. The choice of the geophone layout influences how easy it is to discern the different wave types, which is crucial for the success of a near-surface seismics survey. Students learn which parameters they should try to estimate before the survey, why these parameters are crucial, and how they influence the setup of the survey.
(Note: this resource was added to OER Commons as part of a batch upload of over 2,200 records. If you notice an issue with the quality of the metadata, please let us know by using the 'report' button and we will flag it for consideration.)
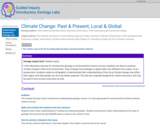
Average inquiry level: Guided inquiry In this laboratory exercise for introductory geology …
Average inquiry level: Guided inquiry In this laboratory exercise for introductory geology or environmental science courses, students use data to examine climate change in their local environment. They compare local changes to global data over different time scales. As an assessment, students create an infographic to demonstrate their understanding of how local climate change may affect their region and what people can do to be better prepared. This lab was originally designed for online instruction, but may be used in face-to-face instruction as well.
(Note: this resource was added to OER Commons as part of a batch upload of over 2,200 records. If you notice an issue with the quality of the metadata, please let us know by using the 'report' button and we will flag it for consideration.)
No restrictions on your remixing, redistributing, or making derivative works. Give credit to the author, as required.
Your remixing, redistributing, or making derivatives works comes with some restrictions, including how it is shared.
Your redistributing comes with some restrictions. Do not remix or make derivative works.
Most restrictive license type. Prohibits most uses, sharing, and any changes.
Copyrighted materials, available under Fair Use and the TEACH Act for US-based educators, or other custom arrangements. Go to the resource provider to see their individual restrictions.