Read the Fine Print
Und Video-Tutorial Nr.9 ....
- Subject:
- Career and Technical Education
- Material Type:
- Lecture
- Provider:
- JavaWebandMore
- Author:
- Java
- Web and more (Jörg Amelunxen)
- Date Added:
- 01/01/2010
Und Video-Tutorial Nr.9 ....

Kindergarten Eureka Math

Poster showing a holly-decked candle in a window, with the Red Cross symbol in its glow. Forms part of: Willard and Dorothy Straight Collection.

Free PowerPoint Click and Reveal Interactions
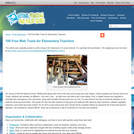
This article includes the URL and description of 100 free web tools that can be used by all teachers. The tools are categorized into search engines, math and science, games, templates and lesson plans, and more.

Short Description:
100 Ideas for Active Learning is a practical handbook to inspire innovative educational experiences. It is for educators and curriculum designers who wish to apply active learning tools and strategies in their own teaching and learning contexts. Effective learning happens through embodied experiences, when students are utilising all their senses - physical, mental, emotional, and social. In this book, practitioners from around the world have come together to author one hundred short chapters, each with an idea designed to help educators encourage their students to take an active learning approach to their studies.
Long Description:
This is a practical handbook for educators and curriculum designers who wish to apply active learning tools and strategies in their own teaching and learning contexts. It contains short chapters under six themes: theory and curriculum design, inclusive communities, transferable skills, assessment and feedback, teaching strategies, digitally-enhanced learning. Practitioners from around the world offer ideas for those wishing to encourage students to take active learning approaches to their studies. Effective learning happens through embodied experiences; when students are applying all their senses, physical, mental, emotional and social.
The book is novel in its inception, scope and aims. Educationalists from across the world have come together to write about something they are passionate about and hope will improve teaching delivery, student learning experiences and assessment integrity for all. Dr Paolo Oprandi, University of Sussex
This book offers practical advice (supported by pedagogical theory) for implementing active learning techniques. It is a great resource for educationalists who are looking for fresh ideas, both in the classroom and online! Nayiri Keshishi, University of Surrey
This book is a must-have tool book for teachers looking to improve engagement and liven up their lessons. This book is recommended for teachers from all stages of their career, from an experienced educator who needs some refreshing to a beginner who requires easy-to-follow creative ideas to support them. What I love about this book is that it offers a diverse range of activities that cater for all subjects. It is also refreshing to have a book containing activities coming from educators across the world. Dr Shelini Surendran, University of Surrey
Produced by a globe-straddling team, this innovative volume was put together whilst authors were dealing with the disruptions of the COVID-19 pandemic. It is a testament to the editorial team, as well as individual authors. The diverse chapters it contains will provide inspiration for educators across disciplines far into the future. Peter Finn, Kingston University
For me, this has quickly become a go-to book for anything Active Learning, covering a myriad of examples and cases for various disciplines and areas of application, from assessment practice to inclusive practice, and will be of value to educationalists exploring active learning principles for the first time, to the veteran pedagogue looking for diverse inspiration. Matt East, Perlego
Word Count: 142064
ISBN: 9780995786271
(Note: This resource's metadata has been created automatically by reformatting and/or combining the information that the author initially provided as part of a bulk import process.)

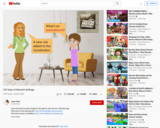
Body language and micro-expressions can provide a wealth of information about a person's emotions, thoughts, and intentions. Regarding openness, certain gestures, postures, and facial expressions can indicate a person is receptive, accepting, or willing to engage. Here are 100 examples of body language and micro-expressions that may indicate openness:

This website gives you the opportunity see the world through different people all over the world on a variety of topics. Watch videos, see lesson plans about global issues and looking at it from a lense of focus on 100 people.

In this lesson, students will read and analyze a mentor text 100 Word Memoir. After studying the mentor text, students will create and evaluate their own 100 Word Memoir.
Learn how brave women fought for the right to vote and won 100 years ago.
Students will bee able to celebrate the 100th day of school by bringing in a project representing it. They will also fill out a chart that has 100 blank squares for them to fill in.
Students will bee able to celebrate the 100th day of school by bringing in a project representing it. They will also fill out a chart that has 100 blank squares for them to fill in.
Resources to mark the 100th day of school with math activities. Challenge students to generate 100 different ways to represent the number 100. Students will easily generate 99 + 1 and 50 + 50, but encourage them to think out of the box. Challenge them to include examples from all of the NCTM Standards strands: number sense, numerical operations, geometry, measurement, algebra, patterns, data analysis, probability, discrete math, Create a class list to record the best entries. Some teachers write 100 in big bubble numeral style and then record the entries inside the numerals.

This lesson understand political parties and their origins.
Celebrating Open Community in the #YearofOpen
Word Count: 7407
(Note: This resource's metadata has been created automatically as part of a bulk import process by reformatting and/or combining the information that the author initially provided. As a result, there may be errors in formatting.)

This source discusses the purpose of research writing.
This is a resource that you can use online or in class. It is a great way to start a conversation with a student on the importance of just living for today.

New Visions: Intro to Enlightenment
very usefull to understand liquid
Teachers of English language can use these slides for middle school B1 English learners to introduce 10 bizarre sport competitions. The duration of the lesson is 30 minutes.