Updating search results...

Search Resources

446 Results

View
Selected filters:
  • Physical Geography
The Blizzard of '49
Conditional Remix & Share Permitted
CC BY-NC-SA
Rating
0.0 stars

The Storm of the Century: The Blizzard of 49 is a WyomingPBS documentary. This documentary tells the story of the worst series of storms in Wyoming's history. But for all the tragedy and loss, suffering, and death, there was hope and heroism, unselfish sacrifice, and generosity. Students will learn about the Blizzard of 1949 and how the State of Wyoming and the Civil Air Patrol responded.

The resource videos are based on this documentary and include associated lesson plans. There are three video clips. Clip one starts at the beginning and ends at 2:50 minutes, Clip two begins at 3:50 minutes and ends at 5:50 minutes, clip three begins at 6:00 minutes and ends at 8:41 minutes.

Sensitive: This resource contains material that may be sensitive for some students. Teachers should exercise discretion in evaluating whether this resource is suitable for their class.

Subject:
Ecology
English Language Arts
Life Science
Physical Geography
Physical Science
Speaking and Listening
Material Type:
Activity/Lab
Lesson
Provider:
Wyoming PBS
Date Added:
09/18/2019
Blue Coral Atlas of US Expansion
Only Sharing Permitted
CC BY-NC-ND
Rating
0.0 stars

Blue Coral Atlas of US Expansion tells the geographic story of the United States from the original thirteen colonies to today. View all the maps together in a single scroll or choose maps either individually or in series together for a closer look.

Blue Coral Atlas of US Expansion is fully responsive in the web browser for large and small devices in both horizontal and vertical orientations.

Subject:
History
Physical Geography
Physical Science
U.S. History
Material Type:
Interactive
Provider:
Blue Coral Learning
Date Added:
01/05/2018
British Columbia in a Global Context
Unrestricted Use
CC BY
Rating
0.0 stars

This first year Geography textbook takes a holistic approach to Geography by incorporating elements of physical, human and regional geography, as well as bringing in methods and perspectives from spatial information science.. This textbook applies a fundamental geographical approach to understanding our globally changing world by looking at local processes which are linked to larger global processes and events. For example mining and its effects are a global issue and we can see how these unfold in BC. A further example is the recent apology to First Nation peoples on the residential school treatment, as similar events occur in the US, Ireland and Australia. Processes of urbanization, a phenomenon which people all over the globe are experiencing, can be seen in Vancouver with our discussion of the city’s development. Geography students, indeed all first year students, need to be able to critically assess their own contexts and environments in order to properly engage with our continually globalizing world.

Subject:
Physical Geography
Physical Science
Material Type:
Textbook
Provider:
BCcampus
Provider Set:
BCcampus Faculty Reviewed Open Textbooks
Author:
Arthur Green
Aviv Ettya
Britta Ricker
Cristina Tenemos
Simon Fraser
Siobhan McPhee
Date Added:
10/31/2014
Building an Idealized Stratigraphic Sequence: Clastic Shoreline Example
Conditional Remix & Share Permitted
CC BY-NC-SA
Rating
0.0 stars

The purpose of this exercise is to guide students through the process of constructing a stratigraphic sequence based on understanding relationships between the production of space and filling that space with sediment.

Subject:
Geology
Physical Geography
Physical Science
Material Type:
Activity/Lab
Provider:
Science Education Resource Center (SERC) at Carleton College
Provider Set:
Teach the Earth
Author:
William W. Little
Date Added:
01/20/2023
CFR Backgrounder: Al-Shabab
Only Sharing Permitted
CC BY-NC-ND
Rating
0.0 stars

The Council on Foreign Relations (CFR) presents a backgrounder on Al-Shabab; an Islamist insurgent group that remains capable of carrying out massive attacks in Somalia and surrounding countries despite a decade-long African Union offensive against the Islamist group. CFR Backgrounders provide an in-depth analysis on current political and economic issues.

Subject:
Arts and Humanities
Cultural Geography
History
Physical Geography
Physical Science
Political Science
Religious Studies
Social Science
World Cultures
World History
Material Type:
Case Study
Lesson
Reading
Author:
Council on Foreign Relations
Date Added:
01/10/2018
CHIN/WCL 3342: Tales of East Asian Cities
Conditional Remix & Share Permitted
CC BY-NC-SA
Rating
0.0 stars

Word Count: 55857

(Note: This resource's metadata has been created automatically by reformatting and/or combining the information that the author initially provided as part of a bulk import process.)

Subject:
Physical Geography
Physical Science
Social Science
Sociology
Material Type:
Textbook
Provider:
University of Houston
Date Added:
12/20/2022
CO2 in the Ice Core Record
Read the Fine Print
Rating
0.0 stars

This video segment, from the 'Earth: The Operators' Manual' featuring climate expert Richard Alley, shows how ice cores stored at the National Ice Core Lab provide evidence that ancient ice contains records of Earth's past climate - specifically carbon dioxide and temperature.

Subject:
Applied Science
Archaeology
Career and Technical Education
Environmental Science
Environmental Studies
Physical Geography
Physical Science
Social Science
Material Type:
Full Course
Provider:
CLEAN: Climate Literacy and Energy Awareness Network
Provider Set:
CLEAN: Climate Literacy and Energy Awareness Network
Author:
Earth: The Operators' Manual
Geoff Haines-Stiles Productions
Date Added:
09/24/2018
Cartography | Indigi-Genius
Only Sharing Permitted
CC BY-NC-ND
Rating
0.0 stars

Cartography is the art and science of graphically representing a geographical area on a flat surface such as a map. For Indigenous peoples, cartography is more than just topography or mapping locations. For many Indigenous communities, it's about values, culture and traditional understandings.

Subject:
Cultural Geography
History
Physical Geography
Physical Science
Social Science
Material Type:
Lecture
Provider:
PBS LearningMedia
Author:
PBS Learning Media
Date Added:
09/05/2023
Cartography and Visualization
Conditional Remix & Share Permitted
CC BY-NC-SA
Rating
0.0 stars

Maps capture the power of place. A well-designed map can stoke our imagination, helping us to understand how a place looks or feels. Maps serve two roles. First, maps facilitate visual communication where knowns are presented to map readers. Second, maps permit visual thinking where insights into patterns and trends in spatial data are explored. In GEOG 486, Cartography & Visualization, you will learn and apply cartographic theory creating appropriately designed maps. You will learn how to associate the visual variables to symbolize types of spatial data. This process creates an appropriate visual hierarchy that conveys an informational hierarchy about the underlying message. Thus, techniques in map design will be applied to produce, evaluate, and critique reference and thematic maps.

Subject:
Applied Science
Business and Communication
Communication
Information Science
Physical Geography
Physical Science
Material Type:
Full Course
Provider:
Penn State College of Earth and Mineral Sciences
Author:
Cary Anderson
Date Added:
10/07/2019
Central American Arc Volcanoes, Petrology, and Geochemistry
Conditional Remix & Share Permitted
CC BY-NC-SA
Rating
0.0 stars

This module teaches basic concepts in igneous petrology through relating hand specimen identification of lavas to major element geochemistry, using the Central American volcanic arc as an example.

Subject:
Chemistry
Geology
Physical Geography
Physical Science
Material Type:
Activity/Lab
Provider:
Science Education Resource Center (SERC) at Carleton College
Provider Set:
Teach the Earth
Author:
Ben Edwards
Bob Stern
Jim Walker
Date Added:
01/20/2023
Changing Planet: Melting Mountain Glaciers
Read the Fine Print
Rating
0.0 stars

This NBC Learn video features climate scientists doing their research on Mt. Kilimanjaro to study the climate of the past. The scientists put the recently observed changes on the glacier into perspective by comparing past climate fluctuations, stressing that the current observed rate of change is unprecedented. Note: you will need to scroll down the Changing Planet video page to get to this video.

Subject:
Applied Science
Archaeology
Career and Technical Education
Environmental Science
Environmental Studies
Physical Geography
Physical Science
Social Science
Provider:
CLEAN: Climate Literacy and Energy Awareness Network
Provider Set:
CLEAN: Climate Literacy and Energy Awareness Network
Author:
NBC Learn video - Changing Planet
Windows to the Universe
Date Added:
09/24/2018
Cities, Trees & Inequality
Conditional Remix & Share Permitted
CC BY-NC
Rating
0.0 stars

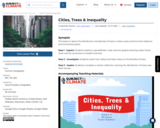
SYNOPSIS: This lesson is about the distribution and density of trees in urban areas and how that relates to environmental justice.

SCIENTIST NOTES: This lesson uses data from peer-reviewed research that breaks down the forest cover in cities as it correlates to income. The evidence is clear and convincing that more affluent neighborhoods have more tree cover, which has a documented benefit on the residents. All external links are scientifically sound, and this lesson has pass our science quality assessment.

POSITIVES:
-This is an engaging lesson because it is so personal. Students will think about tree cover where they live and how that relates to demographic data.
-Students will practice their data analysis skills.

ADDITIONAL PREREQUISITES:
-It is necessary to share the Student Slideshow with your students and give them editing access before beginning the lesson. All students will be writing in the same slideshow.
-The videos list the benefits of trees pretty quickly. It might be hard for students to type fast enough to keep up. You could play the videos at 0.9 speed or replay parts of the videos as necessary.
-The following is a list of benefits of trees. Students will create a similar list while they are watching the two videos outlining the benefits of trees.

-Reduce nearby outside temperatures
-Reduce amount of energy used for heating and cooling buildings
-Absorb carbon dioxide, thus mitigating climate change
-Filter urban pollutants and fine particulates
-Provide habitat, food, and protection to plants and animals
-Provide food for people
-Increase biodiversity
-Provide wood that can be used at the end of a tree’s life
-Improve physical and mental health of people
-Increase property values
-Create oxygen
-Provide shade for people and animals
-Control stormwater runoff, protecting water quality and reducing the need for water treatment
-Protect against mudslides
-Help prevent floods
-Improve air quality
-Increase attention spans and decrease stress levels in people
-Improve health outcomes in hospital patients

DIFFERENTIATION:
-Teachers can use the glossary at the end of the slideshow at any point throughout the lesson to help students understand vocabulary.

-The spreadsheet and the graph on slide 11 might be tricky. Encourage your students to turn and talk to one another for help.

-Many students will not have a good understanding of Celsius. Easy reminder: Multiply the temperature in Celsius by 1.8 to get degrees Fahrenheit. Example: 2.5°C x 1.8 = 4.5°F (The temperature difference between poorest and richest census blocks in Milwaukee, Wisconsin.)

Subject:
Physical Geography
Physical Science
Social Science
Material Type:
Lesson Plan
Provider:
SubjectToClimate
Author:
Dan Castrigano
Date Added:
06/28/2023
Civilización Hispanoamericana
Unrestricted Use
CC BY
Rating
0.0 stars

Short Description:
Un recorrido por la historia y cultura de Hispanoamérica, diseñado para estudiantes de la lengua española a nivel intermedio.

Word Count: 102089

(Note: This resource's metadata has been created automatically by reformatting and/or combining the information that the author initially provided as part of a bulk import process.)

Subject:
English Language Arts
Physical Geography
Physical Science
Material Type:
Textbook
Provider:
SUNY Oneonta
Date Added:
05/28/2022
Climate Change as Simulated by NCAR
Read the Fine Print
Rating
0.0 stars

This animation depicts global surface warming as simulated by NCAR's Community Climate System Model (CCSM) Version 3. It shows the temperature anomalies relative to the end of the 19th century, both over the entire globe and as a global average. The model shows the temporary cooling effects during 5 major volcanic eruptions and estimates future temperature trends based on different amounts of greenhouse gas emissions.

Subject:
Archaeology
Atmospheric Science
Career and Technical Education
Environmental Studies
Physical Geography
Physical Science
Social Science
Provider:
CLEAN: Climate Literacy and Energy Awareness Network
Provider Set:
CLEAN: Climate Literacy and Energy Awareness Network
Author:
National Center for Atmospheric Research (NCAR)
Date Added:
09/24/2018
Climate History and the Cryosphere
Unrestricted Use
CC BY
Rating
0.0 stars

This teaching activity is an introduction to how ice cores from the cryosphere are used as indicators and record-keepers of climate change as well as how climate change will affect the cryosphere.

Subject:
Archaeology
Career and Technical Education
Environmental Studies
Physical Geography
Physical Science
Social Science
Material Type:
Activity/Lab
Provider:
CLEAN: Climate Literacy and Energy Awareness Network
Provider Set:
CLEAN: Climate Literacy and Energy Awareness Network
Author:
Erin Barder
TERC
Date Added:
06/19/2012
Climate History from Deep Sea Sediments
Unrestricted Use
CC BY
Rating
0.0 stars

This activity focuses on reconstructing the Paleocene-Eocene Thermal Maximum (PETM) as an example of a relatively abrupt global warming period. Students access Integrated Ocean Drilling Program (IODP) sediment core data with Virtual Ocean software in order to display relevant marine sediments and their biostratigraphy.

Subject:
Archaeology
Career and Technical Education
Environmental Studies
Physical Geography
Physical Science
Social Science
Material Type:
Activity/Lab
Provider:
CLEAN: Climate Literacy and Energy Awareness Network
Provider Set:
CLEAN: Climate Literacy and Energy Awareness Network
Author:
Cinzia Cervato
Doug Fils
Earth Exploration Toolbook Chapter
Michael Taber
Robert Arko
Victor Fitzjarrald
William Ryan
Date Added:
06/19/2012
Climate Science in a Nutshell: Evidence of a Warming Planet
Read the Fine Print
Rating
0.0 stars

This video is part of the Climate Science in a Nutshell series. This short, animated video looks at evidence of a rapidly warming planet. It discusses how air bubbles in ice cores can be used to estimate Earth's average air temperature for thousands of years and how direct measurements document air temperatures from 1880.

Subject:
Archaeology
Career and Technical Education
Environmental Studies
Physical Geography
Physical Science
Social Science
Provider:
CLEAN: Climate Literacy and Energy Awareness Network
Provider Set:
CLEAN: Climate Literacy and Energy Awareness Network
Author:
Planet Nutshell
Utah Education Network
Date Added:
09/24/2018