Students listen to radio broadcasts about climate change causes, impacts, and solutions …
Students listen to radio broadcasts about climate change causes, impacts, and solutions and learn how this creates a framework for effective scientific communication.
Detailed information is provided in activity description/assignment and an example lab handout …
Detailed information is provided in activity description/assignment and an example lab handout that assisted students in conducting their research.
Initial guidelines given to students:
Choose a location (where you are from, a place that is of interest to you) and investigate how projected changes in climate will affect that area. What are the expected changes in temperature, precipitation, storms, droughts, sea level, seasonality, etc? How will this affect the habitat of the area (for humans, animals, and plants)? How will this affect the local economy? What actions can the people that live in this area take to lessen the impacts of changing climate? Students write a scientific style paper on their findings, and present their research to the class in ~10 minute oral presentations (alternatively a poster session could be used).
(Note: this resource was added to OER Commons as part of a batch upload of over 2,200 records. If you notice an issue with the quality of the metadata, please let us know by using the 'report' button and we will flag it for consideration.)
Resource Watch features hundreds of data sets all in one place on …
Resource Watch features hundreds of data sets all in one place on the state of the planet's resources and citizens. Users can visualize challenges facing people and the planet, from climate change to poverty, water risk to state instability, air pollution to human migration.
This is the ninth and final lesson in a series of lessons …
This is the ninth and final lesson in a series of lessons about climate change. This lesson focuses on the various activities that humans can do to mitigate the effects of climate change. This includes information on current and predicted CO2 emission scenarios across the globe, alternative energy sources, and how people are currently responding to climate change. Importantly, this lesson is motivating in showing students that they can make a difference.
In this video, students learn how scientific surveys of wildlife are performed …
In this video, students learn how scientific surveys of wildlife are performed at a site in Yosemite, California. These surveys, in conjunction with studies from the early 1900s, provide evidence that animal populations in Yosemite have shifted over time in response to rising temperatures.
After conducting an assessment that showed their buildings vulnerability to wind damage, …
After conducting an assessment that showed their buildings vulnerability to wind damage, the Nicklaus Childrens Hospital in Miami looked for a way to improve safety for patients and staff.
This video describes the work of scientists who are studying the precise …
This video describes the work of scientists who are studying the precise combination of trees that would be most effective in reducing the level of greenhouse gases in the air around Syracuse, NY. This is a pilot study that will serve as a model for other urban areas.
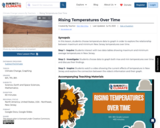
SYNOPSIS: In this lesson, students choose temperature data to graph in order …
SYNOPSIS: In this lesson, students choose temperature data to graph in order to explore the relationship between maximum and minimum New Jersey temperatures over time.
SCIENTIST NOTES: This lesson encourages students to create a visual representation of an available climate dataset. A class discussion walks students through the data and how to navigate through the available information. Students are provided instructions on how to create a graph and are allowed to choose which data they will visually represent. The Student Document introduces and invites students to conduct data analysis on their chosen dataset and encourages critical thinking skills. A short video and discussion questions help students relate current information back to their chosen datasets. This is an interactive lesson that incorporates data analysis with the current issue of climate change.
POSITIVES: -This lesson can be used in any math class. -Students are given voice and choice in this lesson. -Students learn to apply real-world data from a table into a comparable graph. -Students explore the connection between data, graphs, and current effects.
ADDITIONAL PREREQUISITES: -Students should have a basic understanding of average and how it is calculated. -Students should have a basic understanding of reading data tables. -Students should have a basic understanding of graphing and coordinate points expressed as (x, y). -Students should have a basic understanding of the relationship between the x- and y-axes.
DIFFERENTIATION: -Students’ communication and vocabulary can be simple or content-specific with math terminology. -Students can use their graph to make an infographic about temperature and climate change. Students can then present their infographic in class, in a school club, or in the community to raise awareness. -Students can find the line of best fit, find the equation of that line in y = mx + b form, and explain what that line shows about the relationship between average temperatures and time. -Students can use the same data and make different graphs (e.g., bar graph, pie chart, etc.). Students can explain how each graph emphasizes different parts of the same data and explain which graph is best in conveying a specific conclusion.
Warming oceans and melting landlocked ice caused by global climate change may …
Warming oceans and melting landlocked ice caused by global climate change may result in rising sea levels. This rise in sea level combined with increased intensity and frequency of storms will produce storm surges that flood subways, highways, homes, and more. In this activity, visitors design and test adaptations to prepare for flooding caused by sea level rise.
This video explores the work of environmentalist John Hart, a Professor of …
This video explores the work of environmentalist John Hart, a Professor of Environmental Science at U.C. Berkley. In the Rocky Mountains of Colorado, Dr. Hart has established an experimental laboratory in which he has artificially created and maintained a 3-degree increase in surface temperature of a plot of land, and documented the impact on plant species occupying the plot.
This role-playing activity allows students to learn more about the six general …
This role-playing activity allows students to learn more about the six general ways Americans respond to climate change and engage in conversations while embodying these groups. Students will be able to describe the different ways Americans respond to climate change and develop arguments to support their claims.
In this hands-on activity, students explore whether rooftop gardens are a viable …
In this hands-on activity, students explore whether rooftop gardens are a viable option for combating the urban heat island effect. The guiding question is: Can rooftop gardens reduce the temperature inside and outside of houses?
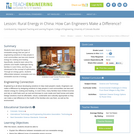
Students learn about five types of renewable energy that are part of …
Students learn about five types of renewable energy that are part of engineering solutions to help people in rural communities use less and cleaner energy for cooking and heating. Specifically, students learn about the pollution and health challenges facing families in rural China, and they are introduced to the concept of optimization. Through an energy game, students differentiate between renewable and non-renewable sources of energy.
Here at TILclimate (Today I Learned: Climate), there’s one question we get …
Here at TILclimate (Today I Learned: Climate), there’s one question we get from our listeners more than any other: “What can I do to make a difference on climate change?” In this special episode of the podcast, three guests who have made acting on climate a big part of their lives join interim host Aaron Krol to share their stories and their advice for those who want to do more. Together, we discuss how to mobilize and inspire others, how small individual actions can lead to large societal ones, and why your contributions to a cooler, more resilient future can have benefits that aren’t just about rising seas or mounting heat waves.
“I love to travel. But I hate the fact that something I …
“I love to travel. But I hate the fact that something I love to do, creates so much pollution.” In this episode of TILclimate (Today I Learned: Climate), MIT professor Steven Barrett and host Laur Hesse Fisher dig into how — and why — air travel impacts our earth’s climate, and what solutions are on the horizon. They explore the surprising heating effect of condensation trails (“contrails”), how computer simulations of the earth’s climate system are built, and what scientists and engineers are doing to make flying, well, less bad for the planet.
Humans have changed clouds: where they form, how much precipitation they produce, …
Humans have changed clouds: where they form, how much precipitation they produce, and how quickly it rains or snows. In this episode of TILclimate (Today I Learned: Climate), MIT professor Dan Cziczo joins host Laur Hesse Fisher to spell out why this is, and what this has to do with climate change. They explore how clouds form in the first place, how human activity has impacted cloud formation and rainfall, and what scientists are still trying to understand. They touch upon the emerging field of geoengineering and how humans could create more clouds to cool the planet -- but we’ll have full episode on that coming out soon.
Humans use around 90 billion metric tons of materials every year, creating …
Humans use around 90 billion metric tons of materials every year, creating about ⅓ of total global greenhouse gas emissions. Which materials produce the most emissions? You might be surprised.
Scientists predict that hurricanes will hit us harder in the future -- …
Scientists predict that hurricanes will hit us harder in the future -- but why? And what can we expect to see? In this episode of #TILclimate (Today I Learned: Climate), MIT professor Kerry Emanuel joins host Laur Hesse Fisher to break down how these “heat engines” work and how a changing climate will increase hurricane intensity, storm surges, and flooding. They also explore how people around the world are adapting to growing hurricane risks.
No restrictions on your remixing, redistributing, or making derivative works. Give credit to the author, as required.
Your remixing, redistributing, or making derivatives works comes with some restrictions, including how it is shared.
Your redistributing comes with some restrictions. Do not remix or make derivative works.
Most restrictive license type. Prohibits most uses, sharing, and any changes.
Copyrighted materials, available under Fair Use and the TEACH Act for US-based educators, or other custom arrangements. Go to the resource provider to see their individual restrictions.