Updating search results...

Search Resources

43 Results

View
Selected filters:
  • r
OpenML: An R Package to Connect to the Machine Learning Platform OpenML
Only Sharing Permitted
CC BY-NC-ND
Rating
0.0 stars

OpenML is an online machine learning platform where researchers can easily share data, machine learning tasks and experiments as well as organize them online to work and collaborate more efficiently. In this paper, we present an R package to interface with the OpenML platform and illustrate its usage in combination with the machine learning R package mlr (Bischl et al, 2016). We show how the OpenML package allows R users to easily search, download and upload data sets and machine learning tasks. Furthermore, we also show how to upload results of experiments, share them with others and download results from other users. Beyond ensuring reproducibility of results, the OpenML platform automates much of the drudge work, speeds up research, facilitates collaboration and increases the users’ visibility online.

Subject:
Social Science
Material Type:
Reading
Author:
Benjamin Hofner
Bernd Bischl
Dominik Kirchhoff
Heidi Seibold
Jakob Bossek
Joaquin Vanschoren
Michel Lang
Pascal Kerschke
Giuseppe Casalicchio
Date Added:
11/13/2020
Openscapes Champions Lesson Series
Unrestricted Use
CC BY
Rating
0.0 stars

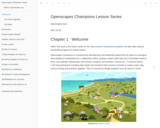
This lesson series is for the Openscapes Champions program, an open data science mentorship program for science teams.

Openscapes Champions is a professional development and leadership opportunity for teams to reimagine data analysis & stewardship as a collaborative effort, develop modern skills that are of immediate value to them, and cultivate collaborative and inclusive research communities. Cohorts are ~7 research teams (~35 total participants including team leads and members) that convene remotely to explore open data science tooling and practices together. This is a remote-by-design program since its launch in 2019.

The Series is written (and always improving) to be used as a reference, to teach, or as self-paced learning.

Openscapes is co-directed by Julia Stewart Lowndes and Erin Robinson. It is operated by the National Center for Ecological Analysis & Synthesis (NCEAS) and was incubated by a Mozilla Fellowship awarded to Lowndes in 2018.

Subject:
Applied Science
Career and Technical Education
Environmental Studies
Information Science
Material Type:
Lecture Notes
Lesson
Primary Source
Author:
Erin Robinson
Julia Stewart Lowndes
Openscapes Team
Date Added:
01/04/2022
Programming with R
Unrestricted Use
CC BY
Rating
0.0 stars

The best way to learn how to program is to do something useful, so this introduction to R is built around a common scientific task: data analysis. Our real goal isn’t to teach you R, but to teach you the basic concepts that all programming depends on. We use R in our lessons because: we have to use something for examples; it’s free, well-documented, and runs almost everywhere; it has a large (and growing) user base among scientists; and it has a large library of external packages available for performing diverse tasks. But the two most important things are to use whatever language your colleagues are using, so you can share your work with them easily, and to use that language well. We are studying inflammation in patients who have been given a new treatment for arthritis, and need to analyze the first dozen data sets of their daily inflammation. The data sets are stored in CSV format (comma-separated values): each row holds information for a single patient, and the columns represent successive days. The first few rows of our first file look like this: 0,0,1,3,1,2,4,7,8,3,3,3,10,5,7,4,7,7,12,18,6,13,11,11,7,7,4,6,8,8,4,4,5,7,3,4,2,3,0,0 0,1,2,1,2,1,3,2,2,6,10,11,5,9,4,4,7,16,8,6,18,4,12,5,12,7,11,5,11,3,3,5,4,4,5,5,1,1,0,1 0,1,1,3,3,2,6,2,5,9,5,7,4,5,4,15,5,11,9,10,19,14,12,17,7,12,11,7,4,2,10,5,4,2,2,3,2,2,1,1 0,0,2,0,4,2,2,1,6,7,10,7,9,13,8,8,15,10,10,7,17,4,4,7,6,15,6,4,9,11,3,5,6,3,3,4,2,3,2,1 0,1,1,3,3,1,3,5,2,4,4,7,6,5,3,10,8,10,6,17,9,14,9,7,13,9,12,6,7,7,9,6,3,2,2,4,2,0,1,1 We want to: load that data into memory, calculate the average inflammation per day across all patients, and plot the result. To do all that, we’ll have to learn a little bit about programming.

Subject:
Applied Science
Computer Science
Information Science
Mathematics
Measurement and Data
Material Type:
Module
Provider:
The Carpentries
Author:
Diya Das
Katrin Leinweber
Rohit Goswami
Date Added:
03/20/2017
Python textbook for Statistical inference and data science
Unrestricted Use
CC BY
Rating
0.0 stars

The chapters in their current form have been made available to students who used Python in my Decision Science course in Fall 2019 (the course I had to prep for. Most students used R, but this helped those who choose Python). It has also been used as reference for students and project partners who use Python but have not had any training on using Python for data management.

This work is still useful for those learning Python as a data analysis platform as well as those who need to convert R code into Python due to deployment needs or to take advantage of Python resources in other domains. While it was not used as a textbook, the material was used by students in my decision models course and in senior capstone course for those who choose to use Python instead of R. While it seemed to help, the students had more difficulty than students who used R.

Subject:
Applied Science
Computer Science
Material Type:
Textbook
Author:
Kiatikun Louis Luangkesorn
Date Added:
11/07/2022
Qualitative Research Using Open Tools
Unrestricted Use
CC BY
Rating
0.0 stars

Qualitative research has long suffered from a lack of free tools for analysis, leaving no options for researchers without significant funds for software licenses. This presents significant challenges for equity. This panel discussion will explore the first two free/libre open source qualitative analysis tools out there: qcoder (R package) and Taguette (desktop application). Drawing from the diverse backgrounds of the presenters (social science, library & information science, software engineering), we will discuss what openness and extensibility means for qualitative research, and how the two tools we've built facilitate equitable, open sharing.

Subject:
Applied Science
Life Science
Physical Science
Social Science
Material Type:
Lesson
Provider:
New York University
Author:
Beth M. Duckles
Vicky Steeves
Date Added:
05/07/2019
Quantitative Research Methods for Political Science, Public Policy and Public Administration for Undergraduates: 1st Edition With Applications in R
Unrestricted Use
CC BY
Rating
0.0 stars

Quantitative Research Methods for Political Science, Public Policy and Public Administration for Undergraduates: 1st Edition With Applications in R is an adaption of Quantitative Research Methods for Political Science, Public Policy and Public Administration (With Applications in R). The focus of this book is on using quantitative research methods to test hypotheses and build theory in political science, public policy and public administration. This new version of the text omits large portions of the original text that focused on calculus and linear algebra, expands and reorganizes the content on the software system R and includes guided study questions at the end of each chapter.

Subject:
Political Science
Social Science
Material Type:
Textbook
Provider:
East Tennessee State University
Author:
Aaron Fister
Gary Copeland
Hank Jenkins-Smith
Joseph Ripberger
Josie Davis
Matthew Nowlin
Tyler Hughes
Wehde Wesley
Date Added:
07/02/2020
R Basics: Data Cleaning and Wrangling with Tidyverse
Conditional Remix & Share Permitted
CC BY-NC
Rating
0.0 stars

This resource is a lesson on data cleaning and wrangling in R using the tidyverse package. It introduces R beginners to using R, best practices with R, the R environment, and basic coding with R

Subject:
Computer Science
Material Type:
Data Set
Lecture Notes
Reading
Author:
Godsgift Chukwuonye
Date Added:
11/29/2022
RStudio Cheatsheets
Unrestricted Use
CC BY
Rating
0.0 stars

RStudio Cheatsheets

The cheatsheets below make it easy to use some of our favorite packages. Cheatsheets include the following topics:

Python with R and Reticulate Cheatsheet
The reticulate package provides a comprehensive set of tools for interoperability between Python and R. With reticulate, you can call Python from R in a variety of ways including importing Python modules into R scripts, writing R Markdown Python chunks, sourcing Python scripts, and using Python interactively within the RStudio IDE. This cheatsheet will remind you how.

Factors with forcats Cheatsheet
Factors are R’s data structure for categorical data. The forcats package makes it easy to work with factors. This cheatsheet reminds you how to make factors, reorder their levels, recode their values, and more.

Tidy Evaluation with rlang Cheatsheet
Tidy Evaluation (Tidy Eval) is a framework for doing non-standard evaluation in R that makes it easier to program with tidyverse functions. Non-standard evaluation, better thought of as “delayed evaluation,” lets you capture a user’s R code to run later in a new environment or against a new data frame. The tidy evaluation framework is implemented by the rlang package and used by functions throughout the tidyverse.

Deep Learning with Keras Cheatsheet
Keras is a high-level neural networks API developed with a focus on enabling fast experimentation. Keras supports both convolution based networks and recurrent networks (as well as combinations of the two), runs seamlessly on both CPU and GPU devices, and is capable of running on top of multiple back-ends including TensorFlow, CNTK, and Theano.

Dates and Times Cheatsheet
Lubridate makes it easier to work with dates and times in R. This lubridate cheatsheet covers how to round dates, work with time zones, extract elements of a date or time, parse dates into R and more. The back of the cheatsheet describes lubridate’s three timespan classes: periods, durations, and intervals; and explains how to do math with date-times.

Work with Strings Cheatsheet
The stringr package provides an easy to use toolkit for working with strings, i.e. character data, in R. This cheatsheet guides you through stringr’s functions for manipulating strings. The back page provides a concise reference to regular expresssions, a mini-language for describing, finding, and matching patterns in strings.

Apply Functions Cheatsheet
The purrr package makes it easy to work with lists and functions. This cheatsheet will remind you how to manipulate lists with purrr as well as how to apply functions iteratively to each element of a list or vector. The back of the cheatsheet explains how to work with list-columns. With list columns, you can use a simple data frame to organize any collection of objects in R.

Data Import Cheatsheet
The Data Import cheatsheet reminds you how to read in flat files with http://readr.tidyverse.org/, work with the results as tibbles, and reshape messy data with tidyr. Use tidyr to reshape your tables into tidy data, the data format that works the most seamlessly with R and the tidyverse.

Data Transformation Cheatsheet
dplyr provides a grammar for manipulating tables in R. This cheatsheet will guide you through the grammar, reminding you how to select, filter, arrange, mutate, summarise, group, and join data frames and tibbles.

Sparklyr Cheatsheet
Sparklyr provides an R interface to Apache Spark, a fast and general engine for processing Big Data. With sparklyr, you can connect to a local or remote Spark session, use dplyr to manipulate data in Spark, and run Spark’s built in machine learning algorithms.

R Markdown Cheatsheet
R Markdown is an authoring format that makes it easy to write reusable reports with R. You combine your R code with narration written in markdown (an easy-to-write plain text format) and then export the results as an html, pdf, or Word file. You can even use R Markdown to build interactive documents and slideshows.

RStudio IDE Cheatsheet
The RStudio IDE is the most popular integrated development environment for R. Do you want to write, run, and debug your own R code? Work collaboratively on R projects with version control? Build packages or create documents and apps? No matter what you do with R, the RStudio IDE can help you do it faster. This cheatsheet will guide you through the most useful features of the IDE, as well as the long list of keyboard shortcuts built into the RStudio IDE.

Shiny Cheatsheet
If you’re ready to build interactive web apps with R, say hello to Shiny. This cheatsheet provides a tour of the Shiny package and explains how to build and customize an interactive app. Be sure to follow the links on the sheet for even more information.

Data Visualization Cheatsheet
The ggplot2 package lets you make beautiful and customizable plots of your data. It implements the grammar of graphics, an easy to use system for building plots. See docs.ggplot2.org for detailed examples.

Package Development Cheatsheet
The devtools package makes it easy to build your own R packages, and packages make it easy to share your R code. Supplement this cheatsheet with r-pkgs.had.co.nz, Hadley’s book on package development.

Subject:
Applied Science
Life Science
Physical Science
Social Science
Material Type:
Student Guide
Provider:
RStudio
Author:
RStudio
Date Added:
08/07/2020
Reproducibility Immersive Course
Conditional Remix & Share Permitted
CC BY-SA
Rating
0.0 stars

Various fields in the natural and social sciences face a ‘crisis of confidence’. Broadly, this crisis amounts to a pervasiveness of non-reproducible results in the published literature. For example, in the field of biomedicine, Amgen published findings that out of 53 landmark published results of pre-clinical studies, only 11% could be replicated successfully. This crisis is not confined to biomedicine. Areas that have recently received attention for non-reproducibility include biomedicine, economics, political science, psychology, as well as philosophy. Some scholars anticipate the expansion of this crisis to other disciplines.This course explores the state of reproducibility. After giving a brief historical perspective, case studies from different disciplines (biomedicine, psychology, and philosophy) are examined to understand the issues concretely. Subsequently, problems that lead to non-reproducibility are discussed as well as possible solutions and paths forward.

Subject:
Applied Science
Life Science
Physical Science
Social Science
Material Type:
Activity/Lab
Provider:
New York University
Author:
Vicky Steeves
Date Added:
06/01/2018
Reproducibility for Data Science
Unrestricted Use
CC BY
Rating
0.0 stars

This course was developed and taught by Ben Marwick, Professor of Archaeology at University of Washington. It is a requirement for the UW Master of Science in Data Science, introduces students to the principles and tools for computational reproducibility in data science using R. Topics covered include acquiring, cleaning and manipulating data in a reproducible workflow using the tidyverse. Students will use literate programming tools, and explore best practices for organizing data analyses. Students will learn to write documents using R markdown, compile R markdown documents using knitr and related tools, and publish reproducible documents to various common formats. Students will learn strategies and tools for packaging research compendia, dependency management, and containerising projects to provide computational isolation.

Subject:
Anthropology
Applied Science
Archaeology
Information Science
Social Science
Material Type:
Full Course
Lecture Notes
Primary Source
Author:
Ben Marwick
Date Added:
01/04/2022
R for Data Science
Only Sharing Permitted
CC BY-NC-ND
Rating
0.0 stars

This is the website for “R for Data Science”. This book will teach you how to do data science with R: You’ll learn how to get your data into R, get it into the most useful structure, transform it, visualise it and model it. In this book, you will find a practicum of skills for data science. Just as a chemist learns how to clean test tubes and stock a lab, you’ll learn how to clean data and draw plots—and many other things besides. These are the skills that allow data science to happen, and here you will find the best practices for doing each of these things with R. You’ll learn how to use the grammar of graphics, literate programming, and reproducible research to save time. You’ll also learn how to manage cognitive resources to facilitate discoveries when wrangling, visualising, and exploring data.

Subject:
Applied Science
Computer Science
Education
Higher Education
Mathematics
Statistics and Probability
Material Type:
Textbook
Author:
Garrett Grolemund
Hadley Wickham
Date Added:
02/01/2021
R for Reproducible Scientific Analysis
Unrestricted Use
CC BY
Rating
0.0 stars

This lesson in part of Software Carpentry workshop and teach novice programmers to write modular code and best practices for using R for data analysis. an introduction to R for non-programmers using gapminder data The goal of this lesson is to teach novice programmers to write modular code and best practices for using R for data analysis. R is commonly used in many scientific disciplines for statistical analysis and its array of third-party packages. We find that many scientists who come to Software Carpentry workshops use R and want to learn more. The emphasis of these materials is to give attendees a strong foundation in the fundamentals of R, and to teach best practices for scientific computing: breaking down analyses into modular units, task automation, and encapsulation. Note that this workshop will focus on teaching the fundamentals of the programming language R, and will not teach statistical analysis. The lesson contains more material than can be taught in a day. The instructor notes page has some suggested lesson plans suitable for a one or half day workshop. A variety of third party packages are used throughout this workshop. These are not necessarily the best, nor are they comprehensive, but they are packages we find useful, and have been chosen primarily for their usability.

Subject:
Applied Science
Computer Science
Information Science
Mathematics
Measurement and Data
Material Type:
Module
Provider:
The Carpentries
Author:
Adam H. Sparks
Ahsan Ali Khoja
Amy Lee
Ana Costa Conrado
Andrew Boughton
Andrew Lonsdale
Andrew MacDonald
Andris Jankevics
Andy Teucher
Antonio Berlanga-Taylor
Ashwin Srinath
Ben Bolker
Bill Mills
Bret Beheim
Clare Sloggett
Daniel
Dave Bridges
David J. Harris
David Mawdsley
Dean Attali
Diego Rabatone Oliveira
Drew Tyre
Elise Morrison
Erin Alison Becker
Fernando Mayer
François Michonneau
Giulio Valentino Dalla Riva
Gordon McDonald
Greg Wilson
Harriet Dashnow
Ido Bar
Jaime Ashander
James Balamuta
James Mickley
Jamie McDevitt-Irwin
Jeffrey Arnold
Jeffrey Oliver
John Blischak
Jonah Duckles
Josh Quan
Julia Piaskowski
Kara Woo
Kate Hertweck
Katherine Koziar
Katrin Leinweber
Kellie Ottoboni
Kevin Weitemier
Kiana Ashley West
Kieran Samuk
Kunal Marwaha
Kyriakos Chatzidimitriou
Lachlan Deer
Lex Nederbragt
Liz Ing-Simmons
Lucy Chang
Luke W Johnston
Luke Zappia
Marc Sze
Marie-Helene Burle
Marieke Frassl
Mark Dunning
Martin John Hadley
Mary Donovan
Matt Clark
Melissa Kardish
Mike Jackson
Murray Cadzow
Narayanan Raghupathy
Naupaka Zimmerman
Nelly Sélem
Nicholas Lesniak
Nicholas Potter
Nima Hejazi
Nora Mitchell
Olivia Rata Burge
Paula Andrea Martinez
Pete Bachant
Phil Bouchet
Philipp Boersch-Supan
Piotr Banaszkiewicz
Raniere Silva
Rayna Michelle Harris
Remi Daigle
Research Bazaar
Richard Barnes
Robert Bagchi
Rémi Emonet
Sam Penrose
Sandra Brosda
Sarah Munro
Sasha Lavrentovich
Scott Allen Funkhouser
Scott Ritchie
Sebastien Renaut
Thea Van Rossum
Timothy Eoin Moore
Timothy Rice
Tobin Magle
Trevor Bekolay
Tyler Crawford Kelly
Vicken Hillis
Yuka Takemon
bippuspm
butterflyskip
waiteb5
Date Added:
03/20/2017
R for Social Scientists
Unrestricted Use
CC BY
Rating
0.0 stars

From Data Carpentry: Data Carpentry’s aim is to teach researchers basic concepts, skills, and tools for working with data so that they can get more done in less time, and with less pain. The lessons below were designed for those interested in working with social sciences data in R.This is an introduction to R designed for participants with no programming experience. These lessons can be taught in a day (~ 6 hours). They start with some basic information about R syntax, the RStudio interface, and move through how to import CSV files, the structure of data frames, how to deal with factors, how to add/remove rows and columns, how to calculate summary statistics from a data frame, and a brief introduction to plotting.

Subject:
Social Science
Material Type:
Activity/Lab
Provider:
New York University
Author:
Vicky Steeves
Date Added:
01/15/2020
R for Social Scientists
Unrestricted Use
CC BY
Rating
0.0 stars

Data Carpentry lesson part of the Social Sciences curriculum. This lesson teaches how to analyse and visualise data used by social scientists. Data Carpentry’s aim is to teach researchers basic concepts, skills, and tools for working with data so that they can get more done in less time, and with less pain. The lessons below were designed for those interested in working with social sciences data in R. This is an introduction to R designed for participants with no programming experience. These lessons can be taught in a day (~ 6 hours). They start with some basic information about R syntax, the RStudio interface, and move through how to import CSV files, the structure of data frames, how to deal with factors, how to add/remove rows and columns, how to calculate summary statistics from a data frame, and a brief introduction to plotting.

Subject:
Applied Science
Information Science
Mathematics
Measurement and Data
Social Science
Material Type:
Module
Provider:
The Carpentries
Author:
Angela Li
Ben Marwick
Christina Maimone
Danielle Quinn
Erin Alison Becker
Francois Michonneau
Geoffrey LaFlair
Hao Ye
Jake Kaupp
Juan Fung
Katrin Leinweber
Martin Olmos
Murray Cadzow
Date Added:
08/07/2020
R on a need-to-know basis
Conditional Remix & Share Permitted
CC BY-NC-SA
Rating
0.0 stars

A step-by-step introduction on how to install and use `R` and RStudio for the purposes of certain courses taught at The University of Texas at Austin.

Subject:
Mathematics
Statistics and Probability
Material Type:
Lecture Notes
Author:
Gordan Zitkovic
Milica Cudina
Date Added:
11/12/2022
R para Análisis Científicos Reproducibles
Unrestricted Use
CC BY
Rating
0.0 stars

Una introducción a R utilizando los datos de Gapminder. El objetivo de esta lección es enseñar a las programadoras principiantes a escribir códigos modulares y adoptar buenas prácticas en el uso de R para el análisis de datos. R nos provee un conjunto de paquetes desarrollados por terceros que se usan comúnmente en diversas disciplinas científicas para el análisis estadístico. Encontramos que muchos científicos que asisten a los talleres de Software Carpentry utilizan R y quieren aprender más. Nuestros materiales son relevantes ya que proporcionan a los asistentes una base sólida en los fundamentos de R y enseñan las mejores prácticas del cómputo científico: desglose del análisis en módulos, automatización tareas y encapsulamiento. Ten en cuenta que este taller se enfoca en los fundamentos del lenguaje de programación R y no en el análisis estadístico. A lo largo de este taller se utilizan una variedad de paquetes desarrolados por terceros, los cuales no son necesariamente los mejores ni se encuentran explicadas todas sus funcionalidades, pero son paquetes que consideramos útiles y han sido elegidos principalmente por su facilidad de uso.

Subject:
Applied Science
Computer Science
Information Science
Mathematics
Measurement and Data
Material Type:
Module
Provider:
The Carpentries
Author:
0xgc
A. s
Alejandra Gonzalez-Beltran
Ana Beatriz Villaseñor Altamirano
Antonio
AntonioJBT
Belinda Weaver
Claudia Engel
Cynthia Monastirsky
Daniel Beiter
David Mawdsley
David Pérez-Suárez
Erin Becker
EuniceML
François Michonneau
Gordon McDonald
Guillermina Actis
Guillermo Movia
Hely Salgado
Ido Bar
Ivan Ogasawara
Ivonne Lujano
James J Balamuta
Jamie McDevitt-Irwin
Jeff Oliver
Jonah Duckles
Juan M. Barrios
Katrin Leinweber
Kevin Alquicira
Kevin Martínez-Folgar
Laura Angelone
Laura-Gomez
Leticia Vega
Marcela Alfaro Córdoba
Marceline Abadeer
Maria Florencia D'Andrea
Marie-Helene Burle
Marieke Frassl
Matias Andina
Murray Cadzow
Narayanan Raghupathy
Naupaka Zimmerman
Paola Prieto
Paula Andrea Martinez
Raniere Silva
Rayna M Harris
Richard Barnes
Richard McCosh
Romualdo Zayas-Lagunas
Sandra Brosda
Sasha Lavrentovich
Shirley Alquicira Hernandez
Silvana Pereyra
Tobin Magle
Veronica Jimenez
juli arancio
raynamharris
saynomoregrl
Date Added:
08/07/2020
Social Science Workshop Overview
Unrestricted Use
CC BY
Rating
0.0 stars

Workshop overview for the Data Carpentry Social Sciences curriculum. Data Carpentry’s aim is to teach researchers basic concepts, skills, and tools for working with data so that they can get more done in less time, and with less pain. This workshop teaches data management and analysis for social science research including best practices for data organization in spreadsheets, reproducible data cleaning with OpenRefine, and data analysis and visualization in R. This curriculum is designed to be taught over two full days of instruction. Materials for teaching data analysis and visualization in Python and extraction of information from relational databases using SQL are in development. Interested in teaching these materials? We have an onboarding video and accompanying slides available to prepare Instructors to teach these lessons. After watching this video, please contact team@carpentries.org so that we can record your status as an onboarded Instructor. Instructors who have completed onboarding will be given priority status for teaching at centrally-organized Data Carpentry Social Sciences workshops.

Subject:
Applied Science
Information Science
Mathematics
Measurement and Data
Social Science
Material Type:
Module
Provider:
The Carpentries
Author:
Angela Li
Erin Alison Becker
Francois Michonneau
Maneesha Sane
Sarah Brown
Tracy Teal
Date Added:
08/07/2020
Statistical Inference via Data Science: A ModernDive into R and the Tidyverse
Conditional Remix & Share Permitted
CC BY-NC-SA
Rating
0.0 stars

Help! I’m completely new to coding and I need to learn R and RStudio! What do I do?

If you’re asking yourself this question, then you’ve come to the right place! Start with the “Introduction for students” section.

Are you an instructor hoping to use this book in your courses? We recommend reading the “Introduction for students” section first. Then, read the “Introduction for instructors” section for more information on how to teach with this book.
Are you looking to connect with and contribute to ModernDive? Then, read the “Connect and contribute” section for information on how.
Are you curious about the publishing of this book? Then, read the “About this book” section for more information on the open-source technology, in particular R Markdown and the bookdown package.

This record and link is to the website for the book: Statistical Inference via Data Science: A ModernDive into R and the Tidyverse!

Subject:
Applied Science
Computer Science
Mathematics
Measurement and Data
Statistics and Probability
Material Type:
Textbook
Provider:
Smith College
Author:
Albert Y. Kim
Chester Ismay
Date Added:
12/06/2022
Séquence 1-Introduction à l'Analyse en Composante Principale avec le langage R- niveau débutant
Conditional Remix & Share Permitted
CC BY-NC
Rating
0.0 stars

C'est une formation en ligne qui vise à aider les participants à réaliser une Analyse en composante Principale (ACP). Le niveau débutant de cette formation se compose de deux séquences. La séquence1 permet de découvrir les notions de base de l'ACP (principe, objectifs, avantages, inconénients,..). Le public cible: étudiants en master de recherche ou professionnel, doctorants, docteurs, enseignants, chercheurs, ingénieurs, médecins, autres. 

Subject:
Computer Science
Material Type:
Lecture
Author:
Imen Ayadi
Date Added:
11/26/2023
Séquence 3- Réalisation d'une Analyse en Composante Principale avec R version 4.3.2- niveau intermédiaire
Conditional Remix & Share Permitted
CC BY-NC-SA
Rating
0.0 stars

C'est une formation en ligne qui vise à aider les participants à réaliser une Analyse en composante Principale (ACP). Le niveau intermédiaire de cette formation porte sur l'utilisation des bibliothèques FactoMineR et  factoextra pour analyser et visualiser l'ACP des variables puis des individus sur un exemple de données iris. Le public cible: étudiants en master de recherche ou professionnel, doctorants, docteurs, enseignants, chercheurs, ingénieurs, médecins, autres.  

Subject:
Computer Science
Statistics and Probability
Material Type:
Activity/Lab
Author:
Imen Ayadi
Date Added:
11/26/2023