Each student or pair of students is provided with an illustration of …
Each student or pair of students is provided with an illustration of a landscape, landform, or geomorphic process and asked to place it in the appropriate location on the timescale answer form (Acrobat (PDF) 8kB Feb28 12) (see the list of landforms and geomorphic processes (Excel 74kB May8 12)). The landforms and processes list includes information on time ranges for each time, time in seconds, and time in years. Note that the time ranges represent approximate values for the processes and that the time in seconds and time in years columns represent low-end values for each respective process. Thus, some processes may fit into multiple locations on the timescale answer form and some revision by students will occur during the initial phase of the activity.
After students have completed their first iteration of the timescale, the instructor will assess the placement of each process on the answer form (Acrobat (PDF) 8kB Feb28 12). The instructor will then determine which processes need further explanation. For some processes, lecture or other learning strategies might be implemented if students do not have a good understanding of the scale in which they occur. For other processes, the instructor may facilitate a discussion to lead students to expand, contract, or alter their perceptions of the time range.
Ultimately, and perhaps towards the end of the lecture period or as a quiz, students will again be asked to complete the timescale answer form.
(Note: this resource was added to OER Commons as part of a batch upload of over 2,200 records. If you notice an issue with the quality of the metadata, please let us know by using the 'report' button and we will flag it for consideration.)
This activity allows students to see several key geologic concepts that they …
This activity allows students to see several key geologic concepts that they will learn in greater detail later in the semester. They compare densities of two different blocks, which serve as proxies for the differences between oceanic and continental crust, and this provides an example of isostasy. They determine sedimentation rates and deduce what type of changes in environment can affect these rates. They determine the relative ages of two different Martian surfaces. Students also get to see hand samples of rock and mineral specimens, and compare hardness and relative sorting. These topics allow students exposure to several different concepts that they will develop a greater appreciation of throughout their courses.
(Note: this resource was added to OER Commons as part of a batch upload of over 2,200 records. If you notice an issue with the quality of the metadata, please let us know by using the 'report' button and we will flag it for consideration.)
Free Open Educational Resources for the Geosciences. The landing page provides links …
Free Open Educational Resources for the Geosciences. The landing page provides links to three textbooks designed for use with introductory courses in Physical Geology, Historical Geology, and Mineralogy. Content contained within each of these books can be utilized across many related courses. The text is written as much as possible at a high school level. Interactive content and quizzes are sprinkled throughout for a better student experience.
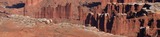
This activity is designed to help students recognize the connections among things …
This activity is designed to help students recognize the connections among things like rock identification and map reading with the "story" that these things can tell us in terms of geologic history. Students have already learned about using observation to identify rocks and the principles of interpreting geologic cross-sections. The activity gives students practice in rock ID, topo map reading, geologic map reading and the aspects of geologic time. Students work with rock samples and a geologic map of the Grand Canyon to interpret a history for the area.
(Note: this resource was added to OER Commons as part of a batch upload of over 2,200 records. If you notice an issue with the quality of the metadata, please let us know by using the 'report' button and we will flag it for consideration.)
Users can choose a time in geologic history, select the link, and …
Users can choose a time in geologic history, select the link, and see what the Earth looked liked in the far distant past. Each map features a brief written description of the events occurring at that time, and a link to additional information on the geologic era or period being shown. There are also maps that show what the Earth might look like in the future, 50, 100, and 150 million years from now.
Students learn how to use the Paleobiology Database (PBDB) to produce maps …
Students learn how to use the Paleobiology Database (PBDB) to produce maps of fossils on the present-day Earth's surface, as well as past continental configurations. They will then use these maps to understand the biogeographic distributions of fossil organisms, and how these distributions constitute evidence for past continental plate positions.
This activity is designed to be flexible and can be used as a lecture, lab, or homework activity. The duration of the activity ranges from 1-1.5 hours, depending on how many fossil distributions are plotted.
Students can work as individuals or in pairs and class size can range from a small seminar (< 10 students) to a large lecture (> 100), as long as sufficient computer facilities are available.
Each student or student pair will need access to a laptop or desktop computer connected to the internet, running an internet browser. The Pangea Puzzle (Acrobat (PDF) 62kB Jul5 17)
(Note: this resource was added to OER Commons as part of a batch upload of over 2,200 records. If you notice an issue with the quality of the metadata, please let us know by using the 'report' button and we will flag it for consideration.)
For this homework assignment, students have to draw two scaled timelines. The …
For this homework assignment, students have to draw two scaled timelines. The first is a personal timeline. They need to come up with the events themselves, an easy task that will build confidence for student who are intimidated by science and math. Following guidelines, they decide on a scale, and draw a linear timeline on which they plot their chosen events. Most students will primarily include recent events. They are asked to identify and explain any patterns in their timeline. Students should note the clustering at the present, and describe the emphasis on the present as resulting from memory, relevance to future hopes and worries, etc.
The second timeline is more traditional. The students are given 16 Earth history events with dates and asked to draw another timeline, using the procedure from the personal timeline, but the line is already drawn for them. They will probably recognize most of the events on the list, and will be keeping them in order and spacing them out on the timeline. They are once again asked to identify and explain patterns and should recognize the emphasis on the present. This time, availability of fossils/rocks and relevance to current conditions and problems are good answers.
(Note: this resource was added to OER Commons as part of a batch upload of over 2,200 records. If you notice an issue with the quality of the metadata, please let us know by using the 'report' button and we will flag it for consideration.)
This optional field trip is designed to augment the in-class learning experience …
This optional field trip is designed to augment the in-class learning experience in introductory physical geology by providing students the opportunity to see firsthand local geological features and understand their context in the long-term tectonic evolution of the western United States. The university is conveniently located in a portion of the American west where a plethora of geological features are readily accessible over a total field trip duration of 6 hours. Over a total of 6 field stops, students are presented with an opportunity to observe features relevant to topics learned in class involving rock types, volcanic features (lava flows and ash fall deposits), faults and folds, mass wasting features, catastrophic flood deposits (Bonneville and Missoula floods), and loess deposits.
(Note: this resource was added to OER Commons as part of a batch upload of over 2,200 records. If you notice an issue with the quality of the metadata, please let us know by using the 'report' button and we will flag it for consideration.)
The four exercises give students an opportunity to use their knowledge of …
The four exercises give students an opportunity to use their knowledge of graphs, algebra, and maps to solve simple geological problems.
(Note: this resource was added to OER Commons as part of a batch upload of over 2,200 records. If you notice an issue with the quality of the metadata, please let us know by using the 'report' button and we will flag it for consideration.)
Groups of 3-4 students work in parallel on different radiocarbon data sets …
Groups of 3-4 students work in parallel on different radiocarbon data sets in this project assignment; the content described here would comprise one group data set including a brief descriptive statement and bibliographic reference, raw data including errors, background lecture notes, and an example final poster presentation.
(Note: this resource was added to OER Commons as part of a batch upload of over 2,200 records. If you notice an issue with the quality of the metadata, please let us know by using the 'report' button and we will flag it for consideration.)
This activity leads students through derivations of the equations associated with radiometric …
This activity leads students through derivations of the equations associated with radiometric dating.
(Note: this resource was added to OER Commons as part of a batch upload of over 2,200 records. If you notice an issue with the quality of the metadata, please let us know by using the 'report' button and we will flag it for consideration.)
Related Links
Radioactive Decay
Exponential Growth and Decay
Peter Kohn - James Madison University
Christopher Gellasch - Uniformed Services University
Jim Sochacki - James Madison University
Scott Eaton - James Madison University
Richard Ford - Weber State University
This exercise introduces students to the use of isochron diagrams & the …
This exercise introduces students to the use of isochron diagrams & the math behind them, by using, plotting, and analyzing a real data set.
(Note: this resource was added to OER Commons as part of a batch upload of over 2,200 records. If you notice an issue with the quality of the metadata, please let us know by using the 'report' button and we will flag it for consideration.)
The nature and scientific measurement of geological and cosmological time are among …
The nature and scientific measurement of geological and cosmological time are among the most misunderstood and difficult to teach concepts in all of K-12 science education. To address this issue, a multi-disciplinary team of geologists, astronomers and education professionals at Western Kentucky University developed a series of professional development workshops for pre- and in-service middle grades teachers. The goals of those workshops were to 1) to develop teacher's content understanding of rates of change and the ages of the earth and universe; and 2) to provide teachers with materials, activities and teaching strategies to help them more effectively educate students about rates of change and the concepts of deep time. Two four-day workshops were held, with each workshop divided into two two-day sessions. Each workshop day consisted of a blend of in-depth content discussions, hands-on activities, and classroom implementation forums. The teachers were provided with all the materials necessary to implement the lessons learned during the workshops as well as publications pertaining to deep time and evolution. Teachers were assessed prior to and immediately after each workshop day and were required to submit a classroom implementation plan as part of their involvement in the workshops.
We have been successful in meeting our workshop goals. The participants clearly advanced their content understanding of geological and cosmological time and the implementation plans received clearly show a desire to apply many of the activities learned in the workshop. Ironically, and despite state science standards mandating coverage of concepts of rates of change and deep time, teachers find that they do not have the time to fully educate their students about geological and cosmological time. We are currently assessment results and are working to disseminate the workshop materials (http://astro.wku.edu/universe).
(Note: this resource was added to OER Commons as part of a batch upload of over 2,200 records. If you notice an issue with the quality of the metadata, please let us know by using the 'report' button and we will flag it for consideration.)
The purpose of this exercise is to introduce students to how simple …
The purpose of this exercise is to introduce students to how simple relative age correlation principles can be used to reliable determine the relative ages of rock units and other geologic features. Students will apply the principles of original horizontality, superposition, cross-cutting relationships and inclusion to determine the relative ages of sedimentary rocks, igneous rocks and metamorphic rocks, as well as unconformities and faults.
(Note: this resource was added to OER Commons as part of a batch upload of over 2,200 records. If you notice an issue with the quality of the metadata, please let us know by using the 'report' button and we will flag it for consideration.)
When piecing together the geologic history of the Earth, geologists rely on …
When piecing together the geologic history of the Earth, geologists rely on several key relative age-dating principles that allow us to determine the relative ages of rocks and the timing of significant geologic events. In a typical Historical Geology class or textbook, instructors/authors briefly discuss the important early researchers in the geological sciences, and then give the name of the stratigraphic principle, useful for relative age-dating of rocks and events, that these 17th and 18th century scientists are credited with discovering. After the instructor/author defines these principles, students are usually shown several examples so they can see how the principle can be applied.
But why not start with the examples and let students discover these principles for themselves?
Students are split into small groups which each work to discover a different relative age-dating principle. The groups are shown photos and given handouts with drawings of rock outcrops illustrating the various principles. These handouts include worksheets for which they must answer a series of prompts that help lead them to the discovery of their relative age-dating principle. Groups must also invent a name for their principle, and select a spokesperson who will present the group's results to the rest of the class.
(Note: this resource was added to OER Commons as part of a batch upload of over 2,200 records. If you notice an issue with the quality of the metadata, please let us know by using the 'report' button and we will flag it for consideration.)
Students are given a short introduction to fossils, strata, Steno's law of …
Students are given a short introduction to fossils, strata, Steno's law of superposition, and the development of the geologic time scale from initial description of systems, through the realization that fossils could be used to correlate between systems, to the assembly of the modern geologic time scale. Then, each student in the course is given a sheet of paper with a simple stratigraphic column and associated fossils representing a geologic system on one side and a short description of the location and history of discovery of the system on the other. On a large wall, students then assemble four geologic columns from their systems representing mainland Europe, Great Britain, the Eastern U.S. and the Western U.S. using the fossils illustrated on their sheets to correlate systems. The instructor guides this process by placing the first system on the wall and by providing some narration as the columns take shape. Europe and Great Britain are assembled first, one sheet at a time, providing when completed the framework of the modern geologic time scale. Once this is up on the wall, the remaining students can assemble the other two columns in minutes using fossils to correlate between American and European systems. A temporal gap in the Grand Canyon sequence provides an opportunity to discuss the incompleteness of the rock record in any one place and a system composed of igneous and metamorphic rocks with no fossils is used to point out the difference between radiometric (absolute) and biostratigraphic (relative) dating.
(Note: this resource was added to OER Commons as part of a batch upload of over 2,200 records. If you notice an issue with the quality of the metadata, please let us know by using the 'report' button and we will flag it for consideration.)
Students are expected to complete readings related to relative time principles prior …
Students are expected to complete readings related to relative time principles prior to class (most don't do it). This activity allows them to apply the rules and extend their knowledge by drawing their own diagram.
(Note: this resource was added to OER Commons as part of a batch upload of over 2,200 records. If you notice an issue with the quality of the metadata, please let us know by using the 'report' button and we will flag it for consideration.)
This lab helps students bring together their ability to describe and identify …
This lab helps students bring together their ability to describe and identify rocks and to push students to think about how the rocks formed based upon their understanding of the geological processes taking place at certain tectonic boundaries.
(Note: this resource was added to OER Commons as part of a batch upload of over 2,200 records. If you notice an issue with the quality of the metadata, please let us know by using the 'report' button and we will flag it for consideration.)
After having talked about the geologic time scale (Precambrian: prior to 570 …
After having talked about the geologic time scale (Precambrian: prior to 570 Ma; Paleozoic: 570-245 Ma; Mesozoic: 245-65 Ma; Cenozoic: 65 Ma - Present), I ask for two volunteers from the class to hold a rope that is 50 feet long. I say that one end is the beginning of the Earth (4.6 billion years ago), and the other is today. I then give out 16 clothes pins and ask various students to put a cloths pin on the 'time line' at various 'geologic events'. For example, I ask them to put one where the dinosaurs died out (end of the Mesozoic). They almost invariably put it much too old (65 Ma is less than 2% of Earth history!). Then I ask them to put one on their birthday (they now laugh). Then I ask them to put one where we think hominoids (humans) evolved (~3-4 Ma), and they realize that we have not been here very long geologically. Then I ask them to put one at the end of the Precambrian, where life took off in terms of the numbers of species, etc. They are amazed that this only represents less than 15% of Earth history. Throughout the activity I have a quiz going on where the students calculate percentages of Earth History for major geologic events, and compare it to their own ages. On their time scale, the dinosaurs died only about two 'months' ago! The exercise is very effective at letting them get a sense of how long geologic time is, and how 'recently' some major geologic events happened when you consider a time scale that is the age of the earth.
(Note: this resource was added to OER Commons as part of a batch upload of over 2,200 records. If you notice an issue with the quality of the metadata, please let us know by using the 'report' button and we will flag it for consideration.)
The process of mud settling in a graduated cylinder was filmed as …
The process of mud settling in a graduated cylinder was filmed as a time lapse series over about 2 hours. Students observe and analyze the sedimentation process.
(Note: this resource was added to OER Commons as part of a batch upload of over 2,200 records. If you notice an issue with the quality of the metadata, please let us know by using the 'report' button and we will flag it for consideration.)
No restrictions on your remixing, redistributing, or making derivative works. Give credit to the author, as required.
Your remixing, redistributing, or making derivatives works comes with some restrictions, including how it is shared.
Your redistributing comes with some restrictions. Do not remix or make derivative works.
Most restrictive license type. Prohibits most uses, sharing, and any changes.
Copyrighted materials, available under Fair Use and the TEACH Act for US-based educators, or other custom arrangements. Go to the resource provider to see their individual restrictions.