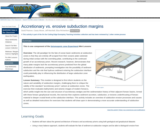
This module examines the nature and variability of subduction margins through examination …
This module examines the nature and variability of subduction margins through examination of data sets that document subduction zone inputs, deformation, and resulting morphology in different settings.
This problem illustrates how numerical theories are developed, how we might test …
This problem illustrates how numerical theories are developed, how we might test this theory with an analog model, and how numerical models are constructed and the limitations of numerical modeling.
(Note: this resource was added to OER Commons as part of a batch upload of over 2,200 records. If you notice an issue with the quality of the metadata, please let us know by using the 'report' button and we will flag it for consideration.)
A student activity to determine the angle of repose and what factors …
A student activity to determine the angle of repose and what factors determine the angle of repose.
(Note: this resource was added to OER Commons as part of a batch upload of over 2,200 records. If you notice an issue with the quality of the metadata, please let us know by using the 'report' button and we will flag it for consideration.)
In this homework assignment students are asked to consider the balance of …
In this homework assignment students are asked to consider the balance of forces on a hill slope using the Factor of Safety.
(Note: this resource was added to OER Commons as part of a batch upload of over 2,200 records. If you notice an issue with the quality of the metadata, please let us know by using the 'report' button and we will flag it for consideration.)
This is one component of the Rupturing Continental Lithosphere suite of mini-lessons. …
This is one component of the Rupturing Continental Lithosphere suite of mini-lessons. Students investigate the morphology of rifted margins by creating topographic/bathymetric maps and profiles across the Red Sea and the Gulf of California (using GeoMapApp ), and describe north-to-south variations in basin morphology in the Gulf of California (including making graphs using Excel). This lab exercise will allow students to examine the roles of structural evolution, sedimentation, and physical and chemical evolution of the crust in the rifting process. This lesson can act as an introduction to more detailed examinations of the roles of sedimentation and obliquity in rifted margins.
Working with data, students develop 3-D understandings of Earth structures using inference …
Working with data, students develop 3-D understandings of Earth structures using inference to construct a block diagram from a collection of 2-D information.
(Note: this resource was added to OER Commons as part of a batch upload of over 2,200 records. If you notice an issue with the quality of the metadata, please let us know by using the 'report' button and we will flag it for consideration.)
There are many, including my environmental and civil engineering technology students, who …
There are many, including my environmental and civil engineering technology students, who do not have decades to commit to developing a working understanding of the Earth and the specific geological and geomorphological contexts they may find themselves working in. Therefore, this textbook is designed to provide a brief introduction to the concepts of geology and geomorphology, with an Ontarian perspective. It serves as a good starting point for individuals who have neither prior experience nor knowledge in geology nor geomorphology. In order to adequately explain concepts that unfold in four dimensions (3 dimensions with time as the fourth), an electronic format is used to leverage enhanced illustrations. These illustrations include traditional 2D figures; however, videos, animations, and interactive figures are also used to help create a deeper understanding.
The purpose of this exercise is to guide students through the process …
The purpose of this exercise is to guide students through the process of constructing a stratigraphic sequence based on understanding relationships between the production of space and filling that space with sediment.
Students measuring elevations in a model map area. Provenance: Lynne Elkins, University …
Students measuring elevations in a model map area.
Provenance: Lynne Elkins, University of Nebraska at Lincoln Reuse: This item is offered under a Creative Commons Attribution-NonCommercial-ShareAlike license http://creativecommons.org/licenses/by-nc-sa/3.0/ You may reuse this item for non-commercial purposes as long as you provide attribution and offer any derivative works under a similar license. This exercise was designed in a department that has some basic support for developing inexpensive classroom equipment in cooperation with a machine shop. The shop built gridded mapping frames to my specifications using a simple aluminum design (a square frame of aluminum with small pins inserted at one-inch intervals). An even simpler DIY design could use thin but sturdy pieces of wood to create a wooden frame, with steel nails. My initial design called for 2'x2' frames, which turned out to be too large: mapping a 4 sq. ft. space at 1-inch resolution took more than a standard lab period for most students to complete. The attached exercise instructs students to use a smaller portion of the mapping grid; this can be revised for different size grids. Another issue to be aware of when designing mapping grid frames is whether to label the spaces with letters and numbers (as is done on many maps and was thus my original thinking) or to label the lines between the spaces, which is easier for data collection.
At the start of the lab, I typically give my students a few ground rules: they should avoid extremely flat areas, because the elevation rounding they are likely to do will make contouring them very difficult; their highest point should be at least 2 inches and not more than 4-5 inches high; they may not have vertical walls or overhangs (and should really keep the slopes less than 60-70Â at their steepest); the table surface is sea level with zero elevation; and most of their model area must be mappable land (not ocean, i.e. bare table). I give them large sheets of wax paper to construct the model on, for easy cleanup. I also provide large sheets of 1" grid paper so they can create a 1:1 map of their model (and I impose a scale calculation later for the model), and remind them several times not to invert the map labels when setting up their map grid. Typically this is all they need to know to begin creating and mapping a landscape. The mapping tools are pieces of string (to string across the pins on the mapping frames and position the grid points) and wooden skewers labeled with quarter-inch markings.
After an initial attempt to make the playdough for this lab, my department opted to purchase 6-lb. tubs of commercial playdough. It is ultimately relatively inexpensive because it is reusable almost indefinitely, as long as it is stored tightly sealed (we use zip-loc bags inside the commercial containers) and occasionally spritzed with water--once a year usually works fine for keeping it hydrated for storage over the rest of the year, but that may vary with climate and frequency of use. Typically I walk around while they are getting started and make commentary on their landscapes, and then when there are no further questions I go to the board and create an example data set and contour map. While a photocopied paper example map would accomplish the same thing, this approach lets me tailor my examples to what I see they are doing (e.g., including circular depressions, saddles, or ridges). I also have handy and frequently refer the students to USGS quads from around the country when they are mapping, e.g. a very flat quad with depressions in central Florida and a very steep quad from the Grand Canyon.
When they are mapping, I typically advise them to 1) sketch in the shoreline around their zero-elevation values by comparing to the model, 2) add major peaks between grid lines as needed, and 3) map from the highest parts of their map area downward. I also discourage contour intervals smaller than 1/2-inch, particularly when their model contains flat terrain. Many students want to be more precise, and if they have estimated depths to the nearest 1/8-inch it is possible to contour at 1/4-inch intervals, but typically their rounded measurements in flat areas make this quite tricky. It often is necessary for me (and/or TAs) to walk around and give them advice in places they are stuck and remind them how contours work.
Making the profile is usually very quick. The graph provided would need to be adjusted/replaced for different size mapping grids, but works well for a grid that runs from A to O on one side and from 1 to 10+ on the other.
If they are kept on task everyone except the most cautious or disorganized groups can typically finish elevation measurements for about 2 sq. ft. of map area within 1.5 hours. With an introductory spiel, that leaves about an hour for finishing most of the contouring and transferring data for the profile. Faster groups will probably finish all the final details but are well-advised to take the lab home to double check the details. Slower groups may finish coloring and looking at the local topo map on their own. Longer lab periods would permit a more detailed study of the local USGS maps and/or a larger model size--this was written for a 3-hour lab period.
(Note: this resource was added to OER Commons as part of a batch upload of over 2,200 records. If you notice an issue with the quality of the metadata, please let us know by using the 'report' button and we will flag it for consideration.)
This activity uses Google Earth to explore the distribution of plate boundaries …
This activity uses Google Earth to explore the distribution of plate boundaries and hotspot volcanoes on Earth. It uses the ages and locations of the hotspot volcanoes to determine the direction and rate of plate motion.
For nearly 100 years, the site that is now High Cliff State …
For nearly 100 years, the site that is now High Cliff State Park near Sherwood, WI was the site of a quicklime kiln. Local Silurian dolomite from the Niagara Escarpment was quarried and baked in large kilns before being shipped by boat on Lake Winnebago at the base of the escarpment. Rejected quicklime spoils are still present near the site of the kiln ruins, resting on the slope leading to the Lake Winnebago shoreline. This project is designed to use basic, low-cost field techniques to determine if any quicklime is moving downslope and into Lake Winnebago. Methods of analysis will include: 1) Placing survey stakes on the quicklime slope to see if they slope is moving, 2) Take several water samples from various points along the lakeshore to test the dissolved mineral content, and 3) Take several water samples from various points along the lakeshore to test the pH. Students will be asked to return to the site several times over the course of a semester in order take samples (particularly after precipitation events) and check the position of the stakes. Students will then use to data to project how far out into the lake the effects of the quicklime extend.
Key words: Quicklime, mass wasting, Niagara Escarpment, water pollution, dissolved minerals
(Note: this resource was added to OER Commons as part of a batch upload of over 2,200 records. If you notice an issue with the quality of the metadata, please let us know by using the 'report' button and we will flag it for consideration.)
DATA: Global Digital Elevation Model (DEM) TOOLS: GeoMapApp, Spreadsheet SUMMARY: Use GeoMapApp …
DATA: Global Digital Elevation Model (DEM) TOOLS: GeoMapApp, Spreadsheet SUMMARY: Use GeoMapApp to search for evidence of glacial expansion and retreat. Produce a research report of your findings modeled on peer-reviewed papers in the field of glaciology.
(Note: this resource was added to OER Commons as part of a batch upload of over 2,200 records. If you notice an issue with the quality of the metadata, please let us know by using the 'report' button and we will flag it for consideration.)
Rapid changes at Earth's surface, largely in response to human activity, have …
Rapid changes at Earth's surface, largely in response to human activity, have led to the realization that fundamental questions remain to be answered regarding the natural functioning of the Critical Zone, the thin veneer at Earth's surface where the atmosphere, lithosphere, hydrosphere and biosphere interact. EARTH 530 will introduce you to the basics necessary for understanding Earth surface processes in the Critical Zone through an integration of various scientific disciplines. Those who successfully complete EARTH 530 will be able to apply their knowledge of fundamental concepts of Earth surface processes to understanding outstanding fundamental questions in Critical Zone science and how their lives are intimately linked to Critical Zone health.
This Lecture Tutorial worksheet is designed for students to work on in …
This Lecture Tutorial worksheet is designed for students to work on in groups after the students have learned about basic surface features and how they relate to planets in general. The tutorial is designed to help students look at these simple features and realize that they are not independent features, but instead are related to the planet as a whole.
(Note: this resource was added to OER Commons as part of a batch upload of over 2,200 records. If you notice an issue with the quality of the metadata, please let us know by using the 'report' button and we will flag it for consideration.)
This activity is a field trip investigation where students gather stream flow, …
This activity is a field trip investigation where students gather stream flow, volume, depth & height (area) data on Ramsey County dams (Keller and Round lake), interpret their findings and make in-depth observations in order to assess the effectiveness of dams through the season and estimate the life-span of the dams in years.
Estuarine Geography utilizes an ecological approach to understanding physical and biological parameters …
Estuarine Geography utilizes an ecological approach to understanding physical and biological parameters to estuarine evolution.. Superimposed upon that spatial site and situation are social, human, cultural and political activities. Humans role in estuarine evolution is discussed at length.
This activity leads to understanding common landslide hazards in the area and …
This activity leads to understanding common landslide hazards in the area and how they relate to weather patterns and/or local geology.
(Note: this resource was added to OER Commons as part of a batch upload of over 2,200 records. If you notice an issue with the quality of the metadata, please let us know by using the 'report' button and we will flag it for consideration.)
In this inquiry based geologic field lab students will be estimating and …
In this inquiry based geologic field lab students will be estimating and measuring stream flow. Students will also map out a full scale live topography map of a dry streambed to help them estimate flow discharge. Students will use their journals to record their hypothesis, lab report questions, graphed data and evidence to backs up their observations.
No restrictions on your remixing, redistributing, or making derivative works. Give credit to the author, as required.
Your remixing, redistributing, or making derivatives works comes with some restrictions, including how it is shared.
Your redistributing comes with some restrictions. Do not remix or make derivative works.
Most restrictive license type. Prohibits most uses, sharing, and any changes.
Copyrighted materials, available under Fair Use and the TEACH Act for US-based educators, or other custom arrangements. Go to the resource provider to see their individual restrictions.