
Conditional Remix & Share Permitted
CC BY-NC
- Subject:
- Mathematics
- Material Type:
- Full Course
- Provider:
- Pearson
- Date Added:
- 10/06/2016

Distributions and Variability
Type of Unit: Project
Prior Knowledge
Students should be able to:
Represent and interpret data using a line plot.
Understand other visual representations of data.
Lesson Flow
Students begin the unit by discussing what constitutes a statistical question. In order to answer statistical questions, data must be gathered in a consistent and accurate manner and then analyzed using appropriate tools.
Students learn different tools for analyzing data, including:
Measures of center: mean (average), median, mode
Measures of spread: mean absolute deviation, lower and upper extremes, lower and upper quartile, interquartile range
Visual representations: line plot, box plot, histogram
These tools are compared and contrasted to better understand the benefits and limitations of each. Analyzing different data sets using these tools will develop an understanding for which ones are the most appropriate to interpret the given data.
To demonstrate their understanding of the concepts, students will work on a project for the duration of the unit. The project will involve identifying an appropriate statistical question, collecting data, analyzing data, and presenting the results. It will serve as the final assessment.
Students form groups and identify a question to investigate for the unit project. Each group submits a proposal outlining the statistical question, the data collection method, and a prediction of results.Key ConceptsStudents will apply what they have learned from the first two lessons to begin the unit project.Goals and Learning ObjectivesChoose a statistical question to answer over the course of the unit.Determine the necessary data collection method.Predict the results.Write a proposal that outlines the project.
Putting Math to Work
Type of Unit: Problem Solving
Prior Knowledge
Students should be able to:
Solve problems with rational numbers using all four operations.
Write ratios and rates.
Use a rate table to solve problems.
Write and solve proportions.
Use multiple representations (e.g., tables, graphs, and equations) to display data.
Identify the variables in a problem situation (i.e., dependent and independent variables).
Write formulas to show the relationship between two variables, and use these formulas to solve for a problem situation.
Draw and interpret graphs that show the relationship between two variables.
Describe graphs that show proportional relationships, and use these graphs to make predictions.
Interpret word problems, and organize information.
Graph in all quadrants of the coordinate plane.
Lesson Flow
As a class, students use problem-solving steps to work through a problem about lightning. In the next lesson, they use the same problem-solving steps to solve a similar problem about lightning. The lightning problems use both rational numbers and rates. Students then choose a topic for a math project. Next, they solve two problems about gummy bears using the problem-solving steps. They then have 3 days of Gallery problems to test their problem-solving skills solo or with a partner. Encourage students to work on at least one problem individually so they can better prepare for a testing situation. The unit ends with project presentations and a short unit test.
In this lesson and the next, student groups make their presentations, provide feedback about other students' presentations, and get evaluated on their listening skills.Key ConceptsIn this culminating event, students must present their project plan and solution to the class. The presentation allows students to explain their problem-solving plan, to communicate their reasoning, and to construct a viable argument about a mathematical problem. Students also listen to other project presentations and provide feedback to the presenters. Listeners have the opportunity to critique the mathematical reasoning of others.Goals and Learning ObjectivesPresent project to the class.Give feedback on other project presentations.Exhibit good listening skills.

Student groups make their presentations, provide feedback for other students' presentations, and get evaluated on their listening skills.Key ConceptsIn this culminating event, students must present their project plan and solution to the class. The presentation allows students to explain their problem-solving plan, to communicate their reasoning, and to construct a viable argument about a mathematical problem. Students also listen to other project presentations and provide feedback to the presenters. Listeners have the opportunity to critique the mathematical reasoning of others.Goals and Learning ObjectivesPresent project to the class.Give feedback on other project presentations.Exhibit good listening skills.Reflect on the problem-solving and project development processes.
Four full-year digital course, built from the ground up and fully-aligned to the Common Core State Standards, for 7th grade Mathematics. Created using research-based approaches to teaching and learning, the Open Access Common Core Course for Mathematics is designed with student-centered learning in mind, including activities for students to develop valuable 21st century skills and academic mindset.

Samples and ProbabilityType of Unit: ConceptualPrior KnowledgeStudents should be able to:Understand the concept of a ratio.Write ratios as percents.Describe data using measures of center.Display and interpret data in dot plots, histograms, and box plots.Lesson FlowStudents begin to think about probability by considering the relative likelihood of familiar events on the continuum between impossible and certain. Students begin to formalize this understanding of probability. They are introduced to the concept of probability as a measure of likelihood, and how to calculate probability of equally likely events using a ratio. The terms (impossible, certain, etc.) are given numerical values. Next, students compare expected results to actual results by calculating the probability of an event and conducting an experiment. Students explore the probability of outcomes that are not equally likely. They collect data to estimate the experimental probabilities. They use ratio and proportion to predict results for a large number of trials. Students learn about compound events. They use tree diagrams, tables, and systematic lists as tools to find the sample space. They determine the theoretical probability of first independent, and then dependent events. In Lesson 10 students identify a question to investigate for a unit project and submit a proposal. They then complete a Self Check. In Lesson 11, students review the results of the Self Check, solve a related problem, and take a Quiz.Students are introduced to the concept of sampling as a method of determining characteristics of a population. They consider how a sample can be random or biased, and think about methods for randomly sampling a population to ensure that it is representative. In Lesson 13, students collect and analyze data for their unit project. Students begin to apply their knowledge of statistics learned in sixth grade. They determine the typical class score from a sample of the population, and reason about the representativeness of the sample. Then, students begin to develop intuition about appropriate sample size by conducting an experiment. They compare different sample sizes, and decide whether increasing the sample size improves the results. In Lesson 16 and Lesson 17, students compare two data sets using any tools they wish. Students will be reminded of Mean Average Deviation (MAD), which will be a useful tool in this situation. Students complete another Self Check, review the results of their Self Check, and solve additional problems. The unit ends with three days for students to work on Gallery problems, possibly using one of the days to complete their project or get help on their project if needed, two days for students to present their unit projects to the class, and one day for the End of Unit Assessment.

Students will form groups for the unit project, decide on a topic, and write up a project proposal. Students will also complete a Self Check that will be discussed in the next lesson.Key ConceptsStudents will apply what they have learned in the unit so far to determine a project. They will also apply their learning to complete a Self Check problem.Goals and Learning ObjectivesDecide on a project topic and group.Write a project proposal.
This module highlights the curricular design and outcomes of undergraduate research in the Department of Geosciences at Fort Lewis College (FLC), supported by an NSF-RUI project (award No. 0911290) on the Navajo volcanic field (NVF). A prime impact of this project was to support the education and career development of undergraduate students by further developing basic knowledge and skills in the context of authentic inquiry on petrologic-based research topics. Integrating research into the curriculum promoted scientific habits of mind by engaging students as "active agents" in discovery, and the creative development and testing of ideas. It also gave students a sense of ownership in the scientific process and knowledge construction. A small group of students from this course continued their research as senior research projects as part of the NSF project.
(Note: this resource was added to OER Commons as part of a batch upload of over 2,200 records. If you notice an issue with the quality of the metadata, please let us know by using the 'report' button and we will flag it for consideration.)
Each spring, students in a 300-level field course collect samples from urban community gardens to monitor soil lead concentrations.
(Note: this resource was added to OER Commons as part of a batch upload of over 2,200 records. If you notice an issue with the quality of the metadata, please let us know by using the 'report' button and we will flag it for consideration.)
Hydrology students are asked to participate in a service-learning project that involves a long-term stream monitoring project. The strengths of this laboratory exercise are that it integrates classroom knowledge with fieldwork, as well as providing the students with a "reason" for doing the lab.
(Note: this resource was added to OER Commons as part of a batch upload of over 2,200 records. If you notice an issue with the quality of the metadata, please let us know by using the 'report' button and we will flag it for consideration.)
Students analyze the natural disaster threat and potential mitigation techniques of their (family) home.
(Note: this resource was added to OER Commons as part of a batch upload of over 2,200 records. If you notice an issue with the quality of the metadata, please let us know by using the 'report' button and we will flag it for consideration.)
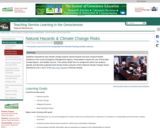
Students characterize how climate change impacts natural hazards and pose research-based solutions to the county Emergency Management Agency. Presentations require the use of local data, created figures, and reliable sources. This activity builds from an assignment which has students identify and describe projected local climate trends using the USGS National Climate Change Viewer followed by Unit 1 and 2 of the Map Your Hazards InTeGrate Module.
(Note: this resource was added to OER Commons as part of a batch upload of over 2,200 records. If you notice an issue with the quality of the metadata, please let us know by using the 'report' button and we will flag it for consideration.)
This is a project asking students to create a new school and to be unique with how they design it.
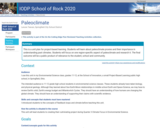
This is a unit plan for project-based learning. Students will learn about paleoclimate proxies and their importance in understanding past climates. Students will focus on one region-specific aspect of paleoclimate and research it. The final outcome will be a public product of relevance to the student, school and community.
(Note: this resource was added to OER Commons as part of a batch upload of over 2,200 records. If you notice an issue with the quality of the metadata, please let us know by using the 'report' button and we will flag it for consideration.)
A wide range of environmental conditions are experienced while hiking the Grand Canyon.
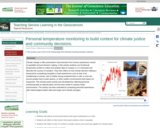
Climate change is often presented in disconnection from human experiences central to equitable and just decision making. In this activity students use PocketLab temperature probes to collect and analyze data on campus or in a local park and describe the sources of variation. They then reflect on how climate decision making is improved by considering inequities in lived experiences such as lack of air conditioning in schools, lack of shelter during sustained heat or cold, or even the access people have to park spaces, or other outdoor environments that impact our enjoyment.
This climate justice activity was developed by collecting personal monitoring data at national parks, but has been tested in campus-urban environments. The activity can been extended by comparing personal experiences with meteorological station data and longer term climate averages.
In this multi-week project, students collect samples in the field, analyze them using various tools and instruments, then present their results and interpretations.
(Note: this resource was added to OER Commons as part of a batch upload of over 2,200 records. If you notice an issue with the quality of the metadata, please let us know by using the 'report' button and we will flag it for consideration.)
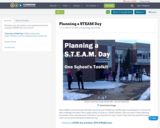
Planning tools, descriptions, and required materials for running a STEAM day at your school
By supplementing existing traditional labs on mineral and rock identification, and on interpreting geologic maps, and creating a lab time for analyzing data available on the web, the students will determine if indoor radon levels correlate best to bedrock geology or to glacial deposits in New York State.
(Note: this resource was added to OER Commons as part of a batch upload of over 2,200 records. If you notice an issue with the quality of the metadata, please let us know by using the 'report' button and we will flag it for consideration.)