Graphs are a common way of presenting information. However, like any other …
Graphs are a common way of presenting information. However, like any other type of representation, graphs rely on shared understandings of symbols and styles to convey meaning. Also, graphs are normally drawn specifically with the intention of presenting information in a particularly favorable or unfavorable light, to convince you of an argument or to influence your decisions.
As science extension activities, this book of problems introduces students to mapping …
As science extension activities, this book of problems introduces students to mapping the shape of the Milky Way galaxy, and how to identify the various kinds of galaxies in our universe. Students also learn about the shapes and sizes of other galaxies in our universe as they learn how to classify them. The math problems cover basic scientific notation skills and how they apply to working with astronomically large numbers. It also provides exercises in plotting points on a Cartesian plane to map the various features of our Milky Way.
Students learn how to use and graph real-world stream gage data to …
Students learn how to use and graph real-world stream gage data to create event and annual hydrographs and calculate flood frequency statistics. Using an Excel spreadsheet of real-world event, annual and peak streamflow data, they manipulate the data (converting units, sorting, ranking, plotting), solve problems using equations, and calculate return periods and probabilities. Prompted by worksheet questions, they analyze the runoff data as engineers would. Students learn how hydrographs help engineers make decisions and recommendations to community stakeholders concerning water resources and flooding.
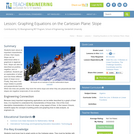
Students learn about four forms of equations: direct variation, slope-intercept form, standard …
Students learn about four forms of equations: direct variation, slope-intercept form, standard form and point-slope form. They graph and complete problem sets for each, converting from one form of equation to another, and learning the benefits and uses of each.
Using different material surfaces, students can measure the amount of friction force …
Using different material surfaces, students can measure the amount of friction force (Newtons) that is required to drag a mass weight or wooden block across each type of surface material. Students will collect and graph data, identifying independent and dependent variables, and complete a scaffolded conclusion.
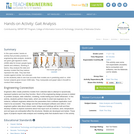
In this open-ended, hands-on activity that provides practice in engineering data analysis, …
In this open-ended, hands-on activity that provides practice in engineering data analysis, students are given gait signature metric (GSM) data for known people types (adults and children). Working in teams, they analyze the data and develop models that they believe represent the data. They test their models against similar, but unknown (to the students) data to see how accurate their models are in predicting adult vs. child human subjects given known GSM data. They manipulate and graph data in Excel® to conduct their analyses.
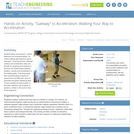
Student teams use sensorsâmotion detectors and accelerometersâto collect walking gait data from …
Student teams use sensorsâmotion detectors and accelerometersâto collect walking gait data from group members. They import their collected position and acceleration data into Excel® for graphing and analysis to discover the relationships between position, velocity and acceleration in the walking gaits. Then they apply their understanding of slopes of secant lines and Riemann sums to generate and graph additional data. These activities provide practice in the data collection and analysis of systems, similar to the work of real-world engineers.
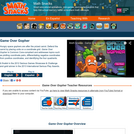
Game Over Gopher is an exciting tower defense game that guides students …
Game Over Gopher is an exciting tower defense game that guides students in plotting coordinate pairs, differentiating negative coordinates from positive coordinates, and identifying the four quadrants. Hungry space gophers are marching towards a prize carrot, and to defend it players place tools around the coordinate grid to “feed” gophers and make them lose interest. Ruby mines (which must be placed at designated x, y coordinates) yield currency that players spend to strategically place carrot launchers, garlic rays, corn silos, and beet traps – gopher feeding tools. To introduce students to the coordinate grid, Game Over Gopher introduces new skills via interactive tutorials and uses consistent visual clues (e.g., x red, y blue) to guide players in plotting coordinates. This means it’s not necessary to teach students coordinate plotting ahead of time. As the levels progress, the number of tools available increases, the level of math vocabulary increases, the scale of the grid changes, and players are asked to expand their mastery of the grid by reflecting points across axes. The game lowers intimidation about the coordinate grid, helps students understand how positive and negative numbers reflect each other across the axes, and helps students get comfortable with the four quadrants.
CK-12's Texas Instruments Geometry Student Edition Flexbook is a useful collection of …
CK-12's Texas Instruments Geometry Student Edition Flexbook is a useful collection of exercises intended to enrich a student's understanding of basic geometric principles.
CK-12's Texas Instruments Geometry Teachers Edition Flexbook is a useful collection of …
CK-12's Texas Instruments Geometry Teachers Edition Flexbook is a useful collection of exercises intended to enrich a student's understanding of basic geometric principles.
Gingerbread men and gingerbread houses enjoy special popularity around the holidays, but …
Gingerbread men and gingerbread houses enjoy special popularity around the holidays, but many of these gingerbread activities are timeless and complement literature titles that teachers use at the beginning of school or after the holidays. It's very easy to incorporate mathematics into a study of gingerbread men, and students will enjoy the data collection activities and games while learning math skills and deepening their understanding of important mathematical concepts. Look through these math activities and add some to your repertoire. Consider broadening the gingerbread math to include measurement, games and problem solving this year.
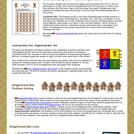
Students learn about an important characteristic of lines: their slopes. Slope can …
Students learn about an important characteristic of lines: their slopes. Slope can be determined either in graphical or algebraic form. Slope can also be described as positive, negative, zero or undefined. Students get an explanation of when and how these different types of slope occur. Finally, they learn how slope relates to parallel and perpendicular lines. When two lines are parallel, they have the same slope and when they are perpendicular their slopes are negative reciprocals of one another.
In this biology lab extension, student will have already collected leaves from …
In this biology lab extension, student will have already collected leaves from the playground and surrounding school areas and sorted them into categories according to leaf properties. Students will use the leave classifications/ sorts to graph the properties of the leaves.
Rebecca Davis sets up a coordinate plane on the floor of her …
Rebecca Davis sets up a coordinate plane on the floor of her classroom. Groups of 3 or 4 students are assigned equations in slope-intercept form and graph them using their bodies on the giant coordinate plane. As extensions, Ms. Davis changes the slope or y-intercept of the original equation and makes the activity into a race.
Students are introduced to different ways of displaying visual spectra, including colored …
Students are introduced to different ways of displaying visual spectra, including colored "barcode" spectra, like those produced by a diffraction grating, and line plots displaying intensity versus color, or wavelength. Students learn that a diffraction grating acts like a prism, bending light into its component colors.
This activity is designed to support a variety of STEM concepts: scientific …
This activity is designed to support a variety of STEM concepts: scientific method, making predictions, gathering and analyzing data, and developing conclusions based on experimentation. This activity draws on active student engagement, and is useful in many STEM content areas.
No restrictions on your remixing, redistributing, or making derivative works. Give credit to the author, as required.
Your remixing, redistributing, or making derivatives works comes with some restrictions, including how it is shared.
Your redistributing comes with some restrictions. Do not remix or make derivative works.
Most restrictive license type. Prohibits most uses, sharing, and any changes.
Copyrighted materials, available under Fair Use and the TEACH Act for US-based educators, or other custom arrangements. Go to the resource provider to see their individual restrictions.