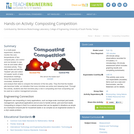
In a multi-week experiment, students monitor the core temperatures of two compost …
In a multi-week experiment, students monitor the core temperatures of two compost piles, one control and one tended, to see how air and water affect microbial activity. They daily aerate and wet the "treated" pile and collect 4-6 weeks' worth of daily temperature readings. Once the experiment is concluded, students plot and analyze their data to compare the behavior of the two piles. They find that the treated pile becomes hotter, an indication that more microbes are active and releasing heat. Through this activity, students see that microbes play a role in composting and how composting can be used as a carbon management process.
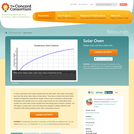
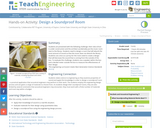
Elementary grade students investigate heat transfer in this activity to design and …
Elementary grade students investigate heat transfer in this activity to design and build a solar oven, then test its effectiveness using a temperature sensor. It blends the hands-on activity with digital graphing tools that allow kids to easily plot and share their data. Included in the package are illustrated procedures and extension activities. Note Requirements: This lesson requires a "VernierGo" temperature sensing device, available for ~ $40. This item is part of the Concord Consortium, a nonprofit research and development organization dedicated to transforming education through technology. The Consortium develops digital learning innovations for science, mathematics, and engineering.
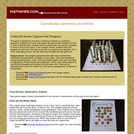
A brief refresher on the Cartesian plane includes how points are written …
A brief refresher on the Cartesian plane includes how points are written in (x, y) format and oriented to the axes, and which directions are positive and negative. Then students learn about what it means for a relation to be a function and how to determine domain and range of a set of data points.
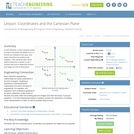
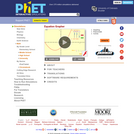
With your mouse, drag data points and their error bars, and watch …
With your mouse, drag data points and their error bars, and watch the best-fit polynomial curve update instantly. You choose the type of fit: linear, quadratic, cubic, or quartic. The reduced chi-square statistic shows you when the fit is good. Or you can try to find the best fit by manually adjusting fit parameters.
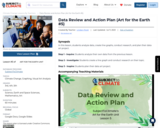
SYNOPSIS: In this lesson, students analyze data, create line graphs, conduct research, …
SYNOPSIS: In this lesson, students analyze data, create line graphs, conduct research, and plan their data art project.
SCIENTIST NOTES: This lesson builds students' data analysis and research skills. Students learn how to use data to create an appealing artwork that can explain and raise awareness on climate change impacts. All materials are properly sourced, and datasets for analysis are accurate. The lesson has passed our science credibility process.
POSITIVES: -Students learn how to create a line graph that includes title, x-axis label, y-axis label, data points, and a line connecting the data points. -Students think critically in their groups and in whole class discussions. -Students practice media literacy skills when conducting research.
ADDITIONAL PREREQUISITES: -This is lesson 5 of 6 in our 3rd-5th grade Art for the Earth unit. -Students should have a basic understanding of data analysis and why graphs are useful tools to view data. -You may have to guide students to good resources when they are conducting research on their topic in the Investigate section. A great tip when students are doing online research is to use the PARC method, which stands for Purpose, Author, Reliability, and Currency. Students can ask of every website: -What is the purpose of this website? -Who is the author of this website? -Is this website reliable? -Is this website current?
DIFFERENTIATION: -It may be best for students to collaborate when creating their line graphs. Grouping students with varying levels of logical-mathematical intelligence and spatial-visual intelligence would probably work best. -Line graphs can also be created using technology tools, including iPads or Chromebooks. -Your students may or may not have different line graphs. If the data comes from a true class campaign, all students will have the same line graph. If students gathered their own data for different issues or used the different available data from NASA, their line graphs will be different. -The Inspire section is meant for students to prepare to complete their projects. They will actually finish their projects in the sixth lesson in this unit after discussing more about the impact of art on one's feelings, how colours affect emotions, and how to appeal to different audiences.
In this lesson, students learn that sound is energy and has the …
In this lesson, students learn that sound is energy and has the ability to do work. Students discover that sound is produced by a vibration and they observe soundwaves and how they travel through mediums. They understand that sound can be absorbed, reflected or transmitted. Through associated activities, videos and a PowerPoint presentation led by the teacher, students further their exploration of sound through discussions in order to build background knowledge.
Student teams design and create LEGO® structures to house and protect temperature …
Student teams design and create LEGO® structures to house and protect temperature sensors. They leave their structures in undisturbed locations for a week, and regularly check and chart the temperatures. This activity engages students in the design and analysis aspects of engineering.
Students are presented with the following challenge: their new school is under …
Students are presented with the following challenge: their new school is under construction and the architect accidentally put the music room next to the library. Students need to design a room that will absorb the most amount of sound so that the music does not disturb the library. Students use a box as a proxy for the room need to create a design that will decrease the sound that is coming from the outside of the box. To evaluate this challenge, students use a speaker within the box and a decibel meter outside the box to measure the effectiveness of their design.
In a multi-week experiment, student teams gather biogas data from the mini-anaerobic …
In a multi-week experiment, student teams gather biogas data from the mini-anaerobic digesters that they build to break down different types of food waste with microbes. Using plastic soda bottles for the mini-anaerobic digesters and gas measurement devices, they compare methane gas production from decomposing hot dogs, diced vs. whole. They monitor and measure the gas production, then graph and analyze the collected data. Students learn how anaerobic digestion can be used to biorecycle waste (food, poop or yard waste) into valuable resources (nutrients, biogas, energy).
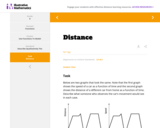
In this task students interpret two graphs that look the same but …
In this task students interpret two graphs that look the same but show very different quantities. The first graph gives information about how fast a car is moving while the second graph gives information about the position of the car. This problem works well to generate a class or small group discussion. Students learn that graphs tell stories and have to be interpreted by carefully thinking about the quantities shown.
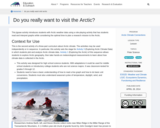
This jigsaw activity introduces students with Arctic weather data using a role-playing …
This jigsaw activity introduces students with Arctic weather data using a role-playing activity that has students read and interpret graphs while considering the optimal time to plan a research mission to the Arctic.
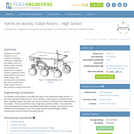
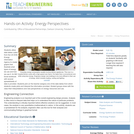
Students act as Mars exploratory rover engineers, designing, building and displaying their …
Students act as Mars exploratory rover engineers, designing, building and displaying their edible rovers to a design review. To begin, they evaluate rover equipment and material options to determine which parts might fit in their given NASA budget. With provided parts and material lists, teams analyze their design options and use their findings to design their rovers.
Students utilize data tables culled from the US DOE Energy Information Agency …
Students utilize data tables culled from the US DOE Energy Information Agency to create graphs that illustrate what types of energy we use and how we use it. An MS Excel workbook with several spreadsheets of data is provided. Students pick (or the teacher assigns) one of the data tables from which students create plots and interpret the information provided. Student groups share with the class their interpretations and new perspectives on energy resources and use.
Students will: Predict the kinetic and potential energy of objects Design a …
Students will: Predict the kinetic and potential energy of objects Design a skate park Examine how kinetic and potential energy interact with each other
Learn about graphing polynomials. The shape of the curve changes as the …
Learn about graphing polynomials. The shape of the curve changes as the constants are adjusted. View the curves for the individual terms (e.g. y=bx ) to see how they add to generate the polynomial curve.
Learn about graphing polynomials. The shape of the curve changes as the …
Learn about graphing polynomials. The shape of the curve changes as the constants are adjusted. View the curves for the individual terms (e.g. y=bx ) to see how they add to generate the polynomial curve.
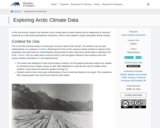
In this activity, students use authentic Arctic climate data to explore albedo …
In this activity, students use authentic Arctic climate data to explore albedo and its relationship to seasonal snowmelt as a self-reinforcing feedback mechanism, which is then applied to large scale global climate change.
No restrictions on your remixing, redistributing, or making derivative works. Give credit to the author, as required.
Your remixing, redistributing, or making derivatives works comes with some restrictions, including how it is shared.
Your redistributing comes with some restrictions. Do not remix or make derivative works.
Most restrictive license type. Prohibits most uses, sharing, and any changes.
Copyrighted materials, available under Fair Use and the TEACH Act for US-based educators, or other custom arrangements. Go to the resource provider to see their individual restrictions.