Students measure the light output and temperature (as a measure of heat …
Students measure the light output and temperature (as a measure of heat output) for three types of light bulbs to identify why some light bulbs are more efficient (more light with less energy) than others.
In this activity, students gain first-hand experience with the mechanical advantage of …
In this activity, students gain first-hand experience with the mechanical advantage of pulleys. Students are given the challenge of helping save a whale by moving it from an aquarium back to its natural habitat into the ocean. They set up different pulley systems, compare the theoretical and actual mechanical advantage of each and discuss their recommendations as a class.
Students work in a whole-class setting, independently, and with partners to design …
Students work in a whole-class setting, independently, and with partners to design and implement a problem-solving plan based on the mathematical concepts of rates and multiple representations (e.g., tables, equations, and graphs). They analyze a rule of thumb and use this relationship to calculate the distance in miles from a viewer's vantage point to lightning.Key ConceptsThroughout this unit, students are encouraged to apply the mathematical concepts they have learned over the course of this year to new settings. Help students develop and refine these problem-solving skills:Creating a problem-solving plan and implementing the plan systematicallyPersevering through challenging problems to find solutionsRecalling prior knowledge and applying that knowledge to new situationsMaking connections between previous learning and real-world problemsCommunicating their approaches with precision and articulating why their strategies and solutions are reasonableCreating efficacy and confidence in solving challenging problems in the real worldGoals and Learning ObjectivesCreate and implement a problem-solving plan.Organize and interpret data presented in a problem situation.Analyze the relationship between two variables.Create a rate table to organize data and make predictions.Apply the relationship between the variables to write a mathematical formula and use the formula to solve problems.Create a graph to display proportional relationships, and use this graph to make predictions.Articulate strategies, thought processes, and approaches to solving a problem, and defend why the solution is reasonable.
Ratios Type of Unit: Concept Prior Knowledge Students should be able to: …
Ratios
Type of Unit: Concept
Prior Knowledge
Students should be able to:
Calculate with whole numbers up to 100 using all four operations. Understand fraction notation and percents and translate among fractions, decimal numbers, and percents. Interpret and use a number line. Use tables to solve problems. Use tape diagrams to solve problems. Sketch and interpret graphs. Write and interpret equations.
Lesson Flow
The first part of the unit begins with an exploration activity that focuses on a ratio as a way to compare the amount of egg and the amount of flour in a mixture. The context motivates a specific understanding of the use of, and need for, ratios as a way of making comparisons between quantities. Following this lesson, the usefulness of ratios in comparing quantities is developed in more detail, including a contrast to using subtraction to find differences. Students learn to interpret and express ratios as fractions, as decimal numbers, in a:b form, in words, and as data; they also learn to identify equivalent ratios.
The focus of the middle part of the unit is on the tools used to represent ratio relationships and on simplifying and comparing ratios. Students learn to use tape diagrams first, then double number lines, and finally ratio tables and graphs. As these tools are introduced, students use them in problem-solving contexts to solve ratio problems, including an investigation of glide ratios. Students are asked to make connections and distinctions among these forms of representation throughout these lessons. Students also choose a ratio project in this part of the unit (Lesson 8).
The third and last part of the unit covers understanding percents, including those greater than 100%.
Students have ample opportunities to check, deepen, and apply their understanding of ratios, including percents, with the selection of problems in the Gallery.
Students use informal methods of their own choosing to find percents of …
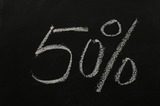
Students use informal methods of their own choosing to find percents of randomly generated monetary values.Key ConceptsMany approaches work for solving percent problems. This lesson focuses on experimenting with a range of approaches and understanding why and how multiple approaches yield correct results.Goals and Learning ObjectivesFind a percent of a given quantity.Find a quantity given a part and the percent that part is of the whole.Use percents in money calculations.
Students interpret multiple categories of data about a hypothetical village population that …
Students interpret multiple categories of data about a hypothetical village population that represents the global population. They determine whether percent statements about the data are true or false.Key ConceptsData presented in multiple formats can be investigated using percent statements that facilitate comparisons between different parts of a whole. In using percents to interpret data, it is essential to be clear about what the part is and what the whole is. The whole in this lesson is a representative sample of the global population, which is used as a model for investigating variation across the population.Goals and Learning ObjectivesInterpret data presented in different formats in terms of percents.Identify percent statements as true or false, if possible, and explain the decision.Modify false percents statements to make them true.
Students use percents greater than 100% to solve problems about rainfall, revenue, …
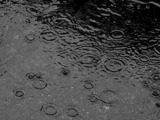
Students use percents greater than 100% to solve problems about rainfall, revenue, snowfall, and school attendance.Key ConceptsPercents greater than 100% are useful in making comparisons between the values of a single quantity at two points in time. When a later value is more than 100% of an earlier value, it means the quantity has increased over time. This percent comparison can be used to find unknown values, whether the earlier or later value is unknown.Goals and Learning ObjectivesUnderstand the meaning of a percent greater than 100% in real-world situations.Use percents greater than 100% to interpret situations and solve problems.
Students begin the lesson with a critique of their own work on …
Students begin the lesson with a critique of their own work on the Self Check using questions and comments from you to reflect on their work. They then critique three examples of student work on the task, each with its own tools for modeling the given relationship between quantities. Finally, they apply what they learned to a closely related problem.Key ConceptsStudents reflect on their work and connect different ways of representing ratio relationships: tape diagrams, double number lines, and ratio tables.Goals and Learning ObjectivesUse teacher comments to refine solution strategies for ratio problems.Deepen understanding of ratio relationships.Synthesize and connect strategies for representing and investigating ratio relationships.Critique given student models created to solve ratio problems.Apply deepened understanding of ratio relationships to a new ratio problem.
In this activity, students investigate the properties of a heterogeneous mixture, trail …
In this activity, students investigate the properties of a heterogeneous mixture, trail mix, as if it were a contaminated soil sample near a construction site. This activity shows students that heterogeneous mixtures can be separated by physical means, and that when separated, all the parts will equal the whole.
Numberstring.com describes number strings as "a set of related math problems, crafted …
Numberstring.com describes number strings as "a set of related math problems, crafted to support students to construct big ideas about mathematics and build their own strategies."
This number string builds students understanding and strategies related to percent, particularly exploring questions such as, "3 is 25% of what number?"
SWBAT articulate strategies for determining a whole when given a part and the percentage it represents.
Our project involves students learning about the values of a natural area …
Our project involves students learning about the values of a natural area in their community and producing a public service announcement and map to show its value and how it could be developed.
This hands-on experiment will provide students with an understanding of the issues …
This hands-on experiment will provide students with an understanding of the issues that surround environmental cleanup. Students will create their own oil spill, try different methods for cleaning it up, and then discuss the merits of each method in terms of effectiveness (cleanliness) and cost. They will be asked to put themselves in the place of both an environmental engineer and an oil company owner who are responsible for the clean-up.
Students work in engineering teams to optimize cleaner energy solutions for cooking …
Students work in engineering teams to optimize cleaner energy solutions for cooking and heating in rural China. They choose between various options for heating, cooking, hot water, and lights and other electricity, balancing between the cost and health effects of different energy choices.
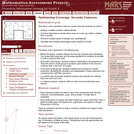
This lesson unit is intended to help sixth grade teachers assess how …
This lesson unit is intended to help sixth grade teachers assess how well students are able to: Analyze a realistic situation mathematically; construct sight lines to decide which areas of a room are visible or hidden from a camera; find and compare areas of triangles and quadrilaterals; and calculate and compare percentages and/or fractions of areas.
Students reinforce their knowledge of the different parts of the digestive system …
Students reinforce their knowledge of the different parts of the digestive system and explore the concept of simulation by developing a pill coating that can withstand the churning actions and acidic environment found in the stomach. Teams test the coating durability by using a clear soda to simulate stomach acid.
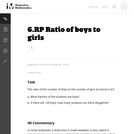
In some textbooks, a distinction is made between a ratio, which is …
In some textbooks, a distinction is made between a ratio, which is assumed to have a common unit for both quantities, and a rate, which is defined to be a quotient of two quantities with different units (e.g. a ratio of the number of miles to the number of hours). No such distinction is made in the common core and hence, the two quantities in a ratio may or may not have a common unit. However, when there is a common unit, as in this problem, it is possible to add the two quantities and then find the ratio of each quantity with respect to the whole (often described as a part-whole relationship).
Why do we care about air? Breathe in, breathe out, breathe in... …
Why do we care about air? Breathe in, breathe out, breathe in... most, if not all, humans do this automatically. Do we really know what is in the air we breathe? In this activity, students use M&M(TM) candies to create pie graphs that show their understanding of the composition of air. They discuss why knowing this information is important to engineers and how engineers use this information to improve technology to better care for our planet.
A quantitative illustration of how non-renewable resources are depleted while renewable resources …
A quantitative illustration of how non-renewable resources are depleted while renewable resources continue to provide energy. Students remove beads (units of energy) from a bag (representing a country). A certain number of beads are removed from the bag each "year." At some point, no non-renewable beads remain. Student groups have different ratios of renewable and non-renewable energy beads. A comparison of the remaining beads and time when they ran out of energy shows the value of utilizing a greater proportion of renewable resources as a sustainable energy resources.
No restrictions on your remixing, redistributing, or making derivative works. Give credit to the author, as required.
Your remixing, redistributing, or making derivatives works comes with some restrictions, including how it is shared.
Your redistributing comes with some restrictions. Do not remix or make derivative works.
Most restrictive license type. Prohibits most uses, sharing, and any changes.
Copyrighted materials, available under Fair Use and the TEACH Act for US-based educators, or other custom arrangements. Go to the resource provider to see their individual restrictions.