In this 6-part activity, students learn about climate change during the Cenozoic …
In this 6-part activity, students learn about climate change during the Cenozoic and the abrupt changes at the Cretaceous/Paleogene boundary (65.5 million years ago), the Eocene/Oligocene boundary (33.9 million years ago), and the Paleocene/Eocene boundary (55.8 million years ago).
In this activity, students use authentic Arctic climate data to unravel some …
In this activity, students use authentic Arctic climate data to unravel some causes and effects related to the seasonal melting of the snowpack and to further understand albedo.
BRIGHT Girls was a project to build broader participation in the sciences, …
BRIGHT Girls was a project to build broader participation in the sciences, led by the University of Alaska Fairbanks and funded by the National Science Foundation. We sought to increase students' motivation and capacity to pursue careers in STEM by engaging them in studies of nearby natural environments. The developed lesson plans may be used in formal or informal educational settings, e.g., in a summer academy or across multiple class periods. These investigations help students explore the relationships among life history and ecosystems, connecting biology to geology and remote sensing.
In this 3-part lab activity, students investigate how carbon moves through the …
In this 3-part lab activity, students investigate how carbon moves through the global carbon cycle and study the effects of specific feedback loops on the carbon cycle.
In this activity students learn how Earth's energy balance is regulating climate. …
In this activity students learn how Earth's energy balance is regulating climate. This activity is lesson 4 in the nine-lesson module Visualizing and Understanding the Science of Climate Change.
This is the seventh of nine lessons in the 'Visualizing and Understanding …
This is the seventh of nine lessons in the 'Visualizing and Understanding the Science of Climate Change' website. This lesson addresses climate feedback loops and how these loops help drive and regulate Earth's unique climate system.
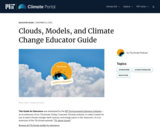
How do clouds form? How are clouds affected by (and how do …
How do clouds form? How are clouds affected by (and how do they affect) climate change? Students create a cloud in the classroom, and then investigate climate models and real-time cloud observation data. This guide is an extension of the TILclimate episode "TIL about clouds."
This Earth Exploration Toolbook chapter is a detailed computer-based exploration in which …
This Earth Exploration Toolbook chapter is a detailed computer-based exploration in which students learn how various climatic conditions impact the formations of sediment layers on the ocean floor. They analyze sediment core data from the Ross Ice Shelf in Antarctica for evidence of climate changes over time. In addition, they interact with various tools and animations throughout the activity, in particular the Paleontological Stratigraphic Interval Construction and Analysis Tool (PSICAT) that is used to construct a climate change model of a sediment core from core images.
The Student Climate Assembly Toolkit describes how we design and implementation of …
The Student Climate Assembly Toolkit describes how we design and implementation of the program. This is not a plug and play unit plan. Instead, it is a guide with options and resources for teachers to adapt this model to their own region and classroom. The primary audience for this toolkit is high school civics teachers, but it may be of interest to other educators.This toolkit includes: a description of SCA preparation, components and how they were presented (section 1); background information about climate science, deliberative democracy, climate justice and social emotional learning (sections 1 & 3); learning standards & student assessment (section 2); sources for teacher and student research (section 3); and examples of SCA teaching tools (section 4)
Students learn what causes earthquakes, how we measure and locate them, and …
Students learn what causes earthquakes, how we measure and locate them, and their effects and consequences. Through the online Earthquakes Living Lab, student pairs explore various types of seismic waves and the differences between shear waves and compressional waves. They conduct research using the portion of the living lab that focuses primarily on the instruments, methods and data used to measure and locate earthquakes. Using real-time U.S. Geological Survey (USGS) data accessed through the living lab interface, students locate where earthquakes are occurring and how frequently. Students propose questions and analyze the real-world seismic data to find answers and form conclusions. They are asked to think critically about why earthquakes occur and how knowledge about earthquakes can be helpful to engineers. A worksheet serves as a student guide for the activity.
Exploring Climate Science With Virtual Reality, a Teacher/Scientist Partnership experience. High school …
Exploring Climate Science With Virtual Reality, a Teacher/Scientist Partnership experience. High school teachers engage with working scientists and engineers to for content learning for climate science and virtual reality and engage in follow-up sessions with professional development facilitators to develop pedagogical expertise for use in creating formative classroom tasks that are formative and productive. It is a three day initial workshop with four follow-up days to 1) deepen teacher understanding by learning with climate scientists to understand climate science standards content knowledge 2) increase awareness and knowledge of the use of virtual reality devices in climate science learning 30 to co-develop a climate science simulation game for use on Oculus Go devices with teachers, their students and a virtual reality scientist/engineer team 4) to develop and implement embedded formative classroom tasks that complement climate science learning by using a relevant, place based phenomena, and provide insights into student thinking and productive next steps in learning.
Creative Commons License CC BY Exploring Climate Science With Virtual Reality Professional Learning Module by Georgia Boatman, ESD 123 and Peggy Willcuts PNNL is licensed under a Creative Commons Attribution 4.0 International License.
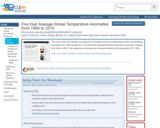
This color-coded map displays a progression of changing five-year average global surface …
This color-coded map displays a progression of changing five-year average global surface temperatures anomalies from 1880 through 2010. The final frame represents global temperature anomalies averaged from 2006 to 2010. The temperature anomalies are computed relative to the base period 1951-1980.
Explore pressure in the atmosphere and underwater. Reshape a pipe to see …
Explore pressure in the atmosphere and underwater. Reshape a pipe to see how it changes fluid flow speed. Experiment with a leaky water tower to see how the height and water level determine the water trajectory.
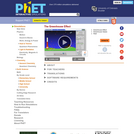
How do greenhouse gases affect the climate? Explore the atmosphere during the …
How do greenhouse gases affect the climate? Explore the atmosphere during the ice age and today. What happens when you add clouds? Change the greenhouse gas concentration and see how the temperature changes. Then compare to the effect of glass panes. Zoom in and see how light interacts with molecules. Do all atmospheric gases contribute to the greenhouse effect?
In this activity, students use maps and data to learn about where …
In this activity, students use maps and data to learn about where and how hurricanes form and possible correlations with climate change affecting their strength.
Hurricanes are a fact of life for millions of Americans each year, …
Hurricanes are a fact of life for millions of Americans each year, and billions more people around the world. What is a hurricane, and how can we prepare for them? Through a model and student-level data, students explore the factors influencing storm frequency and intensity. They also consider the language of storms, as well as steps to resilience. This guide is an extension of the TILclimate episode "TIL about hurricanes."
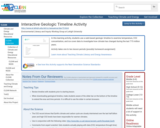
In this learning activity, students use a web-based geologic timeline to examine …
In this learning activity, students use a web-based geologic timeline to examine temperature, CO2 concentration, and ice cover data to investigate how climate has changed during the last 715 million years.
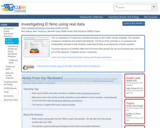
This is a sequence of 5 classroom activities focusing on the El …
This is a sequence of 5 classroom activities focusing on the El NiÃo climate variability. The activities increase in complexity and student-directedness. The focus of the activities is on accessing and manipulating real data to help students understand El NiÃo as an interaction of Earth systems.
The purpose of the resource is to investigate changes in the major …
The purpose of the resource is to investigate changes in the major land cover types of Study Sites by examining Landsat satellite images acquired years apart.
No restrictions on your remixing, redistributing, or making derivative works. Give credit to the author, as required.
Your remixing, redistributing, or making derivatives works comes with some restrictions, including how it is shared.
Your redistributing comes with some restrictions. Do not remix or make derivative works.
Most restrictive license type. Prohibits most uses, sharing, and any changes.
Copyrighted materials, available under Fair Use and the TEACH Act for US-based educators, or other custom arrangements. Go to the resource provider to see their individual restrictions.