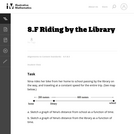
This lesson unit is intended to help teachers assess how well students …
This lesson unit is intended to help teachers assess how well students are able to interpret distanceĐtime graphs and, in particular, to help you identify students who: interpret distanceĐtime graphs as if they are pictures of situations rather than abstract representations of them; and have difficulty relating speeds to slopes of these graphs.
This lesson unit is intended to help teahcers assess how well students …
This lesson unit is intended to help teahcers assess how well students are able to interpret speed as the slope of a linear graph and translate between the equation of a line and its graphical representation.
Monitor the temperature of a melting ice cube and use temperature probes …
Monitor the temperature of a melting ice cube and use temperature probes to electronically plot the data on graphs. Investigate what temperature the ice is as it melts in addition to monitoring the temperature of liquid the ice is submerged in.
This lesson unit is intended to help you assess how well students …
This lesson unit is intended to help you assess how well students use algebra in context, and in particular, how well students: explore relationships between variables in everyday situations; find unknown values from known values; find relationships between pairs of unknowns, and express these as tables and graphs; and find general relationships between several variables, and express these in different ways by rearranging formulae.
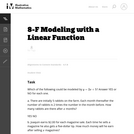
The primary purpose of this task is to elicit common misconceptions that …
The primary purpose of this task is to elicit common misconceptions that arise when students try to model situations with linear functions. This task, being multiple choice, could also serve as a quick assessment to gauge a class' understanding of modeling with linear functions.
Students will breed fruit flies through several generations and record their data …
Students will breed fruit flies through several generations and record their data using mathematical models in order to demonstrate the inheritance of trait variations.
Study the motion of a toy car on a ramp and use motion sensors to digitally graph the position data and then analyze it. Make predictions about what the graphs will look like, and consider what the corresponding velocity graphs would look like.
(Nota: Esta es una traducción de un recurso educativo abierto creado por …
(Nota: Esta es una traducción de un recurso educativo abierto creado por el Departamento de Educación del Estado de Nueva York (NYSED) como parte del proyecto "EngageNY" en 2013. Aunque el recurso real fue traducido por personas, la siguiente descripción se tradujo del inglés original usando Google Translate para ayudar a los usuarios potenciales a decidir si se adapta a sus necesidades y puede contener errores gramaticales o lingüísticos. La descripción original en inglés también se proporciona a continuación.)
En los grados 6 y 7, los estudiantes trabajaron con datos que involucraban una sola variable. El módulo 6 presenta a los estudiantes a bivariando datos. Los estudiantes se introducen a una función como una regla que asigna exactamente un valor a cada entrada. En este módulo, los estudiantes usan su comprensión de las funciones para modelar las posibles relaciones de datos bivariados. Este módulo es importante para establecer una base para los estudiantes que trabajan en álgebra en el grado 9.
English Description: In Grades 6 and 7, students worked with data involving a single variable. Module 6 introduces students to bivariate data. Students are introduced to a function as a rule that assigns exactly one value to each input. In this module, students use their understanding of functions to model the possible relationships of bivariate data. This module is important in setting a foundation for students work in algebra in Grade 9.
The intent of clarifying statements is to provide additional guidance for educators …
The intent of clarifying statements is to provide additional guidance for educators to communicate the intent of the standard to support the future development of curricular resources and assessments aligned to the 2021 math standards. Clarifying statements can be in the form of succinct sentences or paragraphs that attend to one of four types of clarifications: (1) Student Experiences; (2) Examples; (3) Boundaries; and (4) Connection to Math Practices.
In this activity, students explore phase change at a molecular level. They …
In this activity, students explore phase change at a molecular level. They trace the path of an atom to view intermolecular interactions and investigate how temperature relates to phase change. Upon activity completion, students will be able to give examples of phase change, explain how the input of energy into a system affects the state of matter, and describe how both latent heat and evaporative cooling play a role in changes of phase.
Many factors influence the success and survival rate of a population of …
Many factors influence the success and survival rate of a population of living things. Explore several factors that can determine the survival of a population of sheep in this NetLogo model. Start with a model of unlimited grass available to the sheep and watch what happens to the sheep population! Next try to keep the population under control by removing sheep periodically. Change the birthrate, grass regrowth rate, and the amount of energy rabbits get from the grass to keep a stable population.
Measure relative humidity in the air using a simple device made of …
Measure relative humidity in the air using a simple device made of a temperature sensor, a plastic bottle, and some clay. Electronically plot the data you collect on graphs to analyze and learn from it. Experiment with different materials and different room temperatures in order to explore what affects humidity.
This HyperDoc links to a presentation, video clips, and virtual graphs that can …
This HyperDoc links to a presentation, video clips, and virtual graphs that can help students understand how to graph real-world applications of functions.
In this task students draw the graphs of two functions from verbal …
In this task students draw the graphs of two functions from verbal descriptions. Both functions describe the same situation but changing the viewpoint of the observer changes where the function has output value zero. This small twist forces the students to think carefully about the interpretation of the dependent variable.
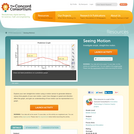
Explore your own straight-line motion using a motion sensor to generate distance …
Explore your own straight-line motion using a motion sensor to generate distance versus time graphs of your own motion. Learn how changes in speed and direction affect the graph, and gain an understanding of how motion can be represented on a graph.
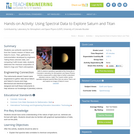
Students use authentic spectral data from the Cassini mission of Saturn and …
Students use authentic spectral data from the Cassini mission of Saturn and Saturn's moon, Titan, gathered by instrumentation developed by engineers. Taking these unknown data, and comparing it with known data, students determine the chemical composition of Saturn's rings and Titan's atmosphere.
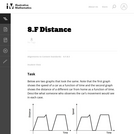
In this task students interpret two graphs that look the same but …
In this task students interpret two graphs that look the same but show very different quantities. The first graph gives information about how fast a car is moving while the second graph gives information about the position of the car. This problem works well to generate a class or small group discussion. Students learn that graphs tell stories and have to be interpreted by carefully thinking about the quantities shown.
No restrictions on your remixing, redistributing, or making derivative works. Give credit to the author, as required.
Your remixing, redistributing, or making derivatives works comes with some restrictions, including how it is shared.
Your redistributing comes with some restrictions. Do not remix or make derivative works.
Most restrictive license type. Prohibits most uses, sharing, and any changes.
Copyrighted materials, available under Fair Use and the TEACH Act for US-based educators, or other custom arrangements. Go to the resource provider to see their individual restrictions.