The year is 2032 and your class has successfully achieved a manned …
The year is 2032 and your class has successfully achieved a manned mission to Mars! After several explorations of the Red Planet, one question is still being debated: "Is there life on Mars?" The class is challenged with the task of establishing criteria to help look for signs of life. Student explorers conduct a scientific experiment in which they evaluate three "Martian" soil samples and determine if any contain life.
In this activity, students examine how to grow plants the most efficiently. …
In this activity, students examine how to grow plants the most efficiently. They imagine that they are designing a biofuels production facility and need to know how to efficiently grow plants to use in this facility. As a means of solving this design problem, they plan a scientific experiment in which they investigate how a given variable (of their choice) affects plant growth. They then make predictions about the outcomes and record their observations after two weeks regarding the condition of the plants' stem, leaves and roots. They use these observations to guide their solution to the engineering design problem. The biological processes of photosynthesis and transpiration are briefly explained to help students make informed decisions about planning and interpreting their investigation and its results.
These activities support students as they conceptually develop a sense of how …
These activities support students as they conceptually develop a sense of how probability affects the outcome of games. Students will find that applying their knowledge of probability will help them win some of the games
This task introduces the fundamental statistical ideas of using data summaries (statistics) …
This task introduces the fundamental statistical ideas of using data summaries (statistics) from random samples to draw inferences (reasoned conclusions) about population characteristics (parameters). In the task built around an election poll scenario, the population is the entire seventh grade class, the unknown characteristic (parameter) of interest is the proportion of the class members voting for a specific candidate, and the sample summary (statistic) is the observed proportion of voters favoring the candidate in a random sample of class members.
This lesson unit is intended to help you assess how well students …
This lesson unit is intended to help you assess how well students are able to: solve simple problems involving ratio and direct proportion; choose an appropriate sampling method; and collect discrete data and record them using a frequency table.
The task is designed to show that random samples produce distributions of …
The task is designed to show that random samples produce distributions of sample means that center at the population mean, and that the variation in the sample means will decrease noticeably as the sample size increases. Random sampling (like mixing names in a hat and drawing out a sample) is not a new idea to most students, although the terminology is likely to be new.
This lesson unit addresses common misconceptions relating to probability of simple and …
This lesson unit addresses common misconceptions relating to probability of simple and compound events. The lesson will help you assess how well students understand concepts of: Equally likely events; randomness; and sample sizes.
Four full-year digital course, built from the ground up and fully-aligned to …
Four full-year digital course, built from the ground up and fully-aligned to the Common Core State Standards, for 7th grade Mathematics. Created using research-based approaches to teaching and learning, the Open Access Common Core Course for Mathematics is designed with student-centered learning in mind, including activities for students to develop valuable 21st century skills and academic mindset.
Samples and ProbabilityType of Unit: ConceptualPrior KnowledgeStudents should be able to:Understand the …
Samples and ProbabilityType of Unit: ConceptualPrior KnowledgeStudents should be able to:Understand the concept of a ratio.Write ratios as percents.Describe data using measures of center.Display and interpret data in dot plots, histograms, and box plots.Lesson FlowStudents begin to think about probability by considering the relative likelihood of familiar events on the continuum between impossible and certain. Students begin to formalize this understanding of probability. They are introduced to the concept of probability as a measure of likelihood, and how to calculate probability of equally likely events using a ratio. The terms (impossible, certain, etc.) are given numerical values. Next, students compare expected results to actual results by calculating the probability of an event and conducting an experiment. Students explore the probability of outcomes that are not equally likely. They collect data to estimate the experimental probabilities. They use ratio and proportion to predict results for a large number of trials. Students learn about compound events. They use tree diagrams, tables, and systematic lists as tools to find the sample space. They determine the theoretical probability of first independent, and then dependent events. In Lesson 10 students identify a question to investigate for a unit project and submit a proposal. They then complete a Self Check. In Lesson 11, students review the results of the Self Check, solve a related problem, and take a Quiz.Students are introduced to the concept of sampling as a method of determining characteristics of a population. They consider how a sample can be random or biased, and think about methods for randomly sampling a population to ensure that it is representative. In Lesson 13, students collect and analyze data for their unit project. Students begin to apply their knowledge of statistics learned in sixth grade. They determine the typical class score from a sample of the population, and reason about the representativeness of the sample. Then, students begin to develop intuition about appropriate sample size by conducting an experiment. They compare different sample sizes, and decide whether increasing the sample size improves the results. In Lesson 16 and Lesson 17, students compare two data sets using any tools they wish. Students will be reminded of Mean Average Deviation (MAD), which will be a useful tool in this situation. Students complete another Self Check, review the results of their Self Check, and solve additional problems. The unit ends with three days for students to work on Gallery problems, possibly using one of the days to complete their project or get help on their project if needed, two days for students to present their unit projects to the class, and one day for the End of Unit Assessment.
Students begin to develop intuition about appropriate sample size by conducting an …
Students begin to develop intuition about appropriate sample size by conducting an experiment. They compare different sample sizes and whether increasing the sample size improves the results.Key ConceptsSampling is a way to discover unknown characteristics about a population. The size of the sample is important in determining the accuracy of the results. Ratio and proportion are used to compare the sample to the population.Goals and Learning ObjectivesStudents will use sampling to determine the number of different color marbles in a jar.Students will explore sample size compared to population size.
Students critique and improve their work on the Self Check, then work …
Students critique and improve their work on the Self Check, then work on additional problems. Students revise the Self Check problem from the previous lesson and discuss their strategies.Key ConceptsStudents apply what they have learned to date to solve the problems in this lesson.Goals and Learning ObjectivesApply knowledge of sampling and data analysis to solve problems.Determine a random, representative sample that is nonbiased and of adequate sample size.Generalize about a population based on sampling.Compare data sets.
Students estimate the length of 50 seconds by starting an unseen timer …
Students estimate the length of 50 seconds by starting an unseen timer and stopping it when they think 50 seconds has elapsed. The third attempt is recorded and compiled into a data set, which students then compare to the third attempt from the previous lesson when they estimated the length of 20 seconds. Students analyze the data to make conclusions about how well seventh grade students can estimate lengths of time.Students repeat the timing activity for 50 seconds, but only the third trial is recorded. The task today is to compare this set of data with the third trial for 20 seconds. Students will need to deal with the difference in the spread of data, as well as how to compare the data sets. Students will be reminded of Mean Absolute Deviation (MAD), which will be a useful tool in this situation.Key ConceptsStudents apply the tools learned in Unit 6.8:Measures of center and spreadMean absolute deviation (MAD)Goals and Learning ObjectivesApply knowledge of statistics to compare different sets of data.Use measures of center and spread to analyze data.
The intent of clarifying statements is to provide additional guidance for educators …
The intent of clarifying statements is to provide additional guidance for educators to communicate the intent of the standard to support the future development of curricular resources and assessments aligned to the 2021 math standards. Clarifying statements can be in the form of succinct sentences or paragraphs that attend to one of four types of clarifications: (1) Student Experiences; (2) Examples; (3) Boundaries; and (4) Connection to Math Practices.
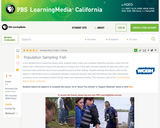
In this lesson designed to enhance literacy skills, students learn about population …
In this lesson designed to enhance literacy skills, students learn about population sampling by watching how a Native American tribe measures the number of fish in their lake.
For this task, Minitab software was used to generate 100 random samples …
For this task, Minitab software was used to generate 100 random samples of size 16 from a population where the probability of obtaining a success in one draw is 33.6% (Bernoulli). Given that multiple samples of the same size have been generated, students should note that there can be quite a bit of variability among the estimates from random samples and that on average, the center of the distribution of such estimates is at the actual population value and most of the estimates themselves tend to cluster around the actual population value.
No restrictions on your remixing, redistributing, or making derivative works. Give credit to the author, as required.
Your remixing, redistributing, or making derivatives works comes with some restrictions, including how it is shared.
Your redistributing comes with some restrictions. Do not remix or make derivative works.
Most restrictive license type. Prohibits most uses, sharing, and any changes.
Copyrighted materials, available under Fair Use and the TEACH Act for US-based educators, or other custom arrangements. Go to the resource provider to see their individual restrictions.