Students use the STELLA program to create hierarchies of models of increasing …
Students use the STELLA program to create hierarchies of models of increasing complexity to understand the absorption of solar energy by the Earth and its radiation of that energy back to space.
(Note: this resource was added to OER Commons as part of a batch upload of over 2,200 records. If you notice an issue with the quality of the metadata, please let us know by using the 'report' button and we will flag it for consideration.)
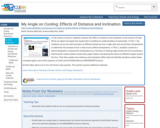
In this hands-on lesson, students measure the effect of distance and inclination …
In this hands-on lesson, students measure the effect of distance and inclination on the amount of heat felt by an object and apply this experiment to building an understanding of seasonality. In Part 1, the students set up two thermometers at different distances from a light bulb and record their temperatures to determine how distance from a heat source affects temperature. In Part 2, students construct a device designed to measure the temperature as a function of viewing angle toward the Sun by placing a thermometer inside a black construction paper sleeve, and placing the device at different angles toward the Sun. They then explain how distance and inclination affect heat and identify situations where these concepts apply, such as the seasons on Earth and the NASA Mercury MESSENGER mission.
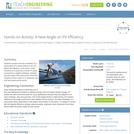
Students examine how the orientation of a photovoltaic (PV) panel relative to …
Students examine how the orientation of a photovoltaic (PV) panel relative to the sun affects the efficiency of the panel. Using sunshine (or a lamp) and a small PV panel connected to a digital multimeter, students vary the angle of the solar panel, record the resulting current output on a worksheet, and plot their experimental results.
This activity develops students' understanding of climate by having them make in-depth …
This activity develops students' understanding of climate by having them make in-depth examinations of historical climate patterns using both graphical and map image formats rather than presenting a general definition of climate. Students explore local climate in order to inform a pen pal what type of weather to expect during an upcoming visit. Students generate and explore a variety of graphs, charts, and map images and interpret them to develop an understanding of climate.
In this classroom activity, students access sea surface temperature and wind speed …
In this classroom activity, students access sea surface temperature and wind speed data from a NASA site, plot and compare data, draw conclusions about surface current and sea surface temperature, and link their gained understanding to concerns about global climate change.
This class will study the behavior of photovoltaic solar energy systems, focusing …
This class will study the behavior of photovoltaic solar energy systems, focusing on the behavior of "stand-alone" systems. The design of stand-alone photovoltaic systems will be covered. This will include estimation of costs and benefits, taking into account any available government subsidies. Introduction to the hardware elements and their behavior will be included.
Students use an existing Excel workbook to investigate how spectral irradiance from …
Students use an existing Excel workbook to investigate how spectral irradiance from a blackbody radiator depends on temperature, Excel Mac or PC
(Note: this resource was added to OER Commons as part of a batch upload of over 2,200 records. If you notice an issue with the quality of the metadata, please let us know by using the 'report' button and we will flag it for consideration.)
To prepare for this exercise, students will read about the Earth's energy …
To prepare for this exercise, students will read about the Earth's energy balance, the electromagnetic spectrum (including visible solar and invisible infrared energy), the effect of the earth's atmosphere, and the earth's resulting general oceanic and atmospheric circulation. For this I like Chapters 3, 4, & 5 in "The Earth System" (2nd Ed.) by Kump, Kasting, & Crane. The students' first step is to estimate zonal averages of Incoming Solar (Shortwave), Absorbed Shortwave, and Outgoing Longwave Radiation from 11x17in color maps of Earth Radiation Budget Experiment (ERBE) data. Then I remix the groups and they create zonal averages of these data at particular longitudes (like Fig. 2-14 in Ruddiman, "Earth's Climate: Past & Future").
(Note: this resource was added to OER Commons as part of a batch upload of over 2,200 records. If you notice an issue with the quality of the metadata, please let us know by using the 'report' button and we will flag it for consideration.)
How does energy flow in and out of our atmosphere? Explore how …
How does energy flow in and out of our atmosphere? Explore how solar and infrared radiation enters and exits the atmosphere with an interactive model. Control the amounts of carbon dioxide and clouds present in the model and learn how these factors can influence global temperature. Record results using snapshots of the model in the virtual lab notebook where you can annotate your observations.
This activity engages learners to investigate the impact of Earth's tilt and …
This activity engages learners to investigate the impact of Earth's tilt and the angle of solar insolation as the reason for seasons by doing a series of hands-on activities that include scale models. Students plot the path of the Sun's apparent movement across the sky on two days separated by three months of time.
In this eight-lesson unit, students explore cultural connections with the sun, learn …
In this eight-lesson unit, students explore cultural connections with the sun, learn about light and discover how light interacts with other materials through hands-on activities, literacy integration, and engineering.
The purpose of this activity is to identify global patterns and connections …
The purpose of this activity is to identify global patterns and connections in environmental data contained in the GLOBE Earth Systems Poster, to connect observations made within the Earth Systems Poster to data and information at the National Snow and Ice Data Center, and to understand the connections between solar energy and changes at the poles, including feedback related to albedo.
In this worksheet-based activity, students review global visualizations of incoming sunlight and …
In this worksheet-based activity, students review global visualizations of incoming sunlight and surface temperature and discuss seasonal change. Students use the visualizations to support inquiry on the differences in seasonal change in the Northern and Southern Hemispheres and how land and water absorb and release heat differently. The activity culminates in an argument about why one hemisphere experiences warmer summers although it receives less total solar energy.
An interactive that illustrates the relationships between the axial tilt of the …
An interactive that illustrates the relationships between the axial tilt of the Earth, latitude, and temperature. Several data sets (including temperature, Sun-Earth distance, daylight hours) can be generated.
Over the course of three sessions, students act as agricultural engineers and …
Over the course of three sessions, students act as agricultural engineers and learn about the sustainable pest control technique known as soil biosolarization in which organic waste is used to help eliminate pests during soil solarization instead of using toxic compounds like pesticides and fumigants. Student teams prepare seed starter pots using a source of microorganisms (soil or compost) and “organic waste” (such as oatmeal, a source of carbon for the microorganisms). They plant seeds (representing weed seeds) in the pots, add water and cover them with plastic wrap. At experiment end, students count the weed seedlings and assess the efficacy of the soil biosolarization technique in inactivating the weed seeds. An experiment-guiding handout and pre/post quizzes are provided.
This short video, the sixth in the National Academies Climate Change, Lines …
This short video, the sixth in the National Academies Climate Change, Lines of Evidence series, explores the hypothesis that changes in solar energy output may be responsible for observed global surface temperature rise. Several lines of evidence, such as direct satellite observations, are reviewed.
In this activity, you will investigate and measure how sunlight is distributed …
In this activity, you will investigate and measure how sunlight is distributed on the earth’s surface in different seasons, illustrating that the seasonal temperature variation has nothing to do with the distance from the earth to the sun, and everything to do with how much direct sunlight a region gets. You will be able to observe how direct sun rays deliver considerably more energy to the earth’s surface than indirect rays.
No restrictions on your remixing, redistributing, or making derivative works. Give credit to the author, as required.
Your remixing, redistributing, or making derivatives works comes with some restrictions, including how it is shared.
Your redistributing comes with some restrictions. Do not remix or make derivative works.
Most restrictive license type. Prohibits most uses, sharing, and any changes.
Copyrighted materials, available under Fair Use and the TEACH Act for US-based educators, or other custom arrangements. Go to the resource provider to see their individual restrictions.