In Module 4, students extend what they already know about unit rates …
In Module 4, students extend what they already know about unit rates and proportional relationships to linear equations and their graphs. Students understand the connections between proportional relationships, lines, and linear equations in this module. Students learn to apply the skills they acquired in Grades 6 and 7, with respect to symbolic notation and properties of equality to transcribe and solve equations in one variable and then in two variables.
Find the rest of the EngageNY Mathematics resources at https://archive.org/details/engageny-mathematics.
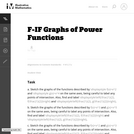
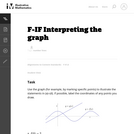
This task requires students to recognize the graphs of different (positive) powers …
This task requires students to recognize the graphs of different (positive) powers of x. There are several important aspects to these graphs. First, the graphs of even powers of x all open upward as x grows in the positive or negative direction. The larger the even power, the flatter these graphs look near 0 and the more rapidly they increase once the distance of x from 0 excedes 1.
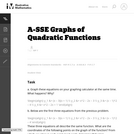
This exploration can be done in class near the beginning of a …
This exploration can be done in class near the beginning of a unit on graphing parabolas. Students need to be familiar with intercepts, and need to know what the vertex is.
This unique activity features a primary source from the Fed's online archive, …
This unique activity features a primary source from the Fed's online archive, FRASER. 75 Years of American Finance: A Graphic Presentation, 1861-1935, is an 85-foot long detailed timeline compiled in 1936. The activity reviews the document layout and provides historical inquiry questions divided into four sections: observe, reflect, question, and analyze. Students can evaluate any given year(s) of the timeline, and the document may be used to introduce historical inquiry and/or to support study of historical themes, years or eras noted in the timeline.
Historians are experts at assessing and analyzing documents to build a narrative …
Historians are experts at assessing and analyzing documents to build a narrative but may be stymied by numbers. Charts (tables, graphs, maps, diagrams, and so on) provide a graphical view of information and can be a powerful way to display evidence. This toolkit provides a series of resources for students to read, interpret, and think critically about charts in textbooks and historical documents.
How to solve for the horizontal displacement when the projectile starts with …
How to solve for the horizontal displacement when the projectile starts with a horizontal initial velocity. We also explain common mistakes people make when doing horizontally launched projectile problems. Created by David SantoPietro.
The goal of this task is to get students to focus on …
The goal of this task is to get students to focus on the shape of the graph of the equation y=ex and how this changes depending on the sign of the exponent and on whether the exponential is in the numerator or denominator. It is also intended to develop familiarity, in the case of f and k, with the functions which are used in logistic growth models, further examined in ``Logistic Growth Model, Explicit Case'' and ``Logistic Growth Model, Abstract Verson.''
Students will examine data on the number of immigrants in the United …
Students will examine data on the number of immigrants in the United States, to create bar graphs and line graphs with appropriate scales. Students will then compare and analyze their graphs to draw conclusions about the data.
Intermediate Algebra is a textbook for students who have some acquaintance with …
Intermediate Algebra is a textbook for students who have some acquaintance with the basic notions of variables and equations, negative numbers, and graphs, although we provide a "Toolkit" to help the reader refresh any skills that may have gotten a little rusty. In this book we journey farther into the subject, to explore a greater variety of topics including graphs and modeling, curve-fitting, variation, exponentials and logarithms, and the conic sections. We use technology to handle data and give some instructions for using a graphing calculator, but these can easily be adapted to any other graphing utility.
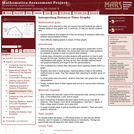
This lesson unit is intended to help teachers assess how well students …
This lesson unit is intended to help teachers assess how well students are able to interpret distanceĐtime graphs and, in particular, to help you identify students who: interpret distanceĐtime graphs as if they are pictures of situations rather than abstract representations of them; and have difficulty relating speeds to slopes of these graphs.
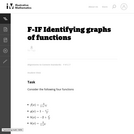
The purpose of this task is to help students learn to read …
The purpose of this task is to help students learn to read information about a function from its graph, by asking them to show the part of the graph that exhibits a certain property of the function. The task could be used to further instruction on understanding functions, or as an assessment tool with the caveat that it requires some amount of creativity to decide how to best illustrate some of the statements.
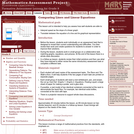
This course provides an introduction to mathematical modeling of computational problems. It …
This course provides an introduction to mathematical modeling of computational problems. It covers the common algorithms, algorithmic paradigms, and data structures used to solve these problems. The course emphasizes the relationship between algorithms and programming, and introduces basic performance measures and analysis techniques for these problems.
Introduction to Statistics is a resource for learning and teaching introductory statistics. …
Introduction to Statistics is a resource for learning and teaching introductory statistics. This work is in the public domain. Therefore, it can be copied and reproduced without limitation. However, we would appreciate a citation where possible. Please cite as: Online Statistics Education: A Multimedia Course of Study (http://onlinestatbook.com/). Project Leader: David M. Lane, Rice University. Instructor's manual, PowerPoint Slides, and additional questions are available.
This lesson plan helps students know what they do to take care …
This lesson plan helps students know what they do to take care of their bodies. In addition, it gives students a chance to practice their graphing skills.
David shows how LOL diagrams allow us to visually represent what we …
David shows how LOL diagrams allow us to visually represent what we mean by conservation of energy as well as what we mean by an energy system. Created by David SantoPietro.
This lesson unit is intended to help teahcers assess how well students …
This lesson unit is intended to help teahcers assess how well students are able to interpret speed as the slope of a linear graph and translate between the equation of a line and its graphical representation.
No restrictions on your remixing, redistributing, or making derivative works. Give credit to the author, as required.
Your remixing, redistributing, or making derivatives works comes with some restrictions, including how it is shared.
Your redistributing comes with some restrictions. Do not remix or make derivative works.
Most restrictive license type. Prohibits most uses, sharing, and any changes.
Copyrighted materials, available under Fair Use and the TEACH Act for US-based educators, or other custom arrangements. Go to the resource provider to see their individual restrictions.