In this activity, students work with climate data from the tropical Pacific …
In this activity, students work with climate data from the tropical Pacific Ocean to understand how sea-surface temperature and atmospheric pressure affect precipitation in the tropical Pacific in a case study format.
In this activity, students examine climate variability in the North Atlantic associated …
In this activity, students examine climate variability in the North Atlantic associated with the North Atlantic Oscillation (NOA) in a case study format.
The students are given the following: Read the articles below about erosion …
The students are given the following:
Read the articles below about erosion along the Lake Erie shoreline and discuss them. What causes the erosion? What can be done to prevent erosion? Should people be allowed to build structures to protect their property from erosion? Should people be allowed to live along the shoreline in high erosion areas?
Students are expected to have completed the coastal erosion module (read text book, view powerpoint lecture and take a quiz) and read articles regarding coastal erosion along the Lake Erie coastline. In the online discussion, students must show that they understand coastal processes, the impact of man made structures on coastal processes, and can apply their values as they discuss what should be done, if anything, to reduce the impact of coastal erosion. Teaching Tips Adaptations that allow this activity to be successful in an online environment This was designed as an online activity. I have also used it in face-to-face courses (students participate in online discussion prior to in-class discussion). Elements of this activity that are most effective This gets students thinking about how what they learn in class can be used to solve real problems faced by the local community and/or the world. Although some students propose impractical solutions, they are at least thinking. Recommendations for other faculty adapting this activity to their own course: Find local issues and/or global issues that show how geology can be used to solve problems.
(Note: this resource was added to OER Commons as part of a batch upload of over 2,200 records. If you notice an issue with the quality of the metadata, please let us know by using the 'report' button and we will flag it for consideration.)
Most students understand that water quality is an important issue, however many …
Most students understand that water quality is an important issue, however many do not understand the complexity associated with the processes involved, the complex nature of estuarine systems, or the fact that management decisions are made based on available data sets that can be difficult at best to interpret. Students will be provided nutrient data in Excel for two Texas estuaries which they will supplement with additional information that they have compiled on these two estuaries during the duration of the course through a GIS database available to the entire class. Furthermore, students will retrieve information from the WWW to learn more about the specific estuaries and the nutrients of interest and their impacts on the environment.
(Note: this resource was added to OER Commons as part of a batch upload of over 2,200 records. If you notice an issue with the quality of the metadata, please let us know by using the 'report' button and we will flag it for consideration.)
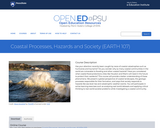
Has your attention recently been caught by news of coastal catastrophes such …
Has your attention recently been caught by news of coastal catastrophes such as hurricanes and tsunamis? Do you wonder why so many coastal communities in the world are vulnerable to flooding and other coastal hazards? Have you considered what coastal flood protections cities like Houston and Miami will need in the future to protect their residents? This course will provide a better understanding of these phenomena. We present a global perspective of coastal landscapes, the geologic processes responsible for their formation, and ways that society responds to hazards like sea level rise and catastrophic weather events. You will participate in active learning exercises such as analyzing real-world datasets and applying critical thinking to real-world societal problems while investigating a coastal community.
This is a semester-long research project that I use to provide students …
This is a semester-long research project that I use to provide students with the opportunity to design a class-wide collaborative research project in connection with a local community partner.
(Note: this resource was added to OER Commons as part of a batch upload of over 2,200 records. If you notice an issue with the quality of the metadata, please let us know by using the 'report' button and we will flag it for consideration.)
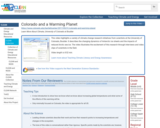
This video highlights a variety of climate change research initiatives from scientists …
This video highlights a variety of climate change research initiatives from scientists at the University of Colorado, Boulder. It describes the changing dynamics of Antarctic ice sheets and the impacts of reduced Arctic sea ice. The video illustrates the excitement of this research through interviews and video clips of scientists in the field.
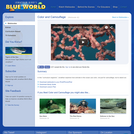
In this video, Jonathan explores how animals in the ocean use color, …
In this video, Jonathan explores how animals in the ocean use color, not just for camouflage, but to stand out. Please see the accompanying lesson plan for educational objectives, discussion points and classroom activities.
In this activity students synthesize ideas from lecture, reading, and viewing two …
In this activity students synthesize ideas from lecture, reading, and viewing two PBS NOVA videos on hurricanes.
(Note: this resource was added to OER Commons as part of a batch upload of over 2,200 records. If you notice an issue with the quality of the metadata, please let us know by using the 'report' button and we will flag it for consideration.)
Conceptests are single item multiple choice questions given in the middle of …
Conceptests are single item multiple choice questions given in the middle of a lecture to assess students' learning of basic concepts. Because Conceptests are projected during class, it is relatively easy to include snippets of data. Students' understanding of the target concepts can then be assessed based on how well they interpret the data rather than how well they answer verbal questions. The Conceptests on this website use bathymetric data from mid-ocean ridges (MOR's) and test students' understanding of MOR volcanism, plate motion direction, seafloor aging, and sedimentation.
(Note: this resource was added to OER Commons as part of a batch upload of over 2,200 records. If you notice an issue with the quality of the metadata, please let us know by using the 'report' button and we will flag it for consideration.)
This activity represents a culmination project for this unit by means of …
This activity represents a culmination project for this unit by means of which students can assess whether the IPCC prediction of increased storminess as an outcome of global warming survives testing. For the previous three weeks students will have conducted several inquiry-based group activities designed to introduce and reinforce fundamental meteorology/climatology concepts. In this 2-day project, students access online AVHRR SST imagery, as well as tabulated numeric data regarding historical North American tropical cyclones, import data into Excel for interpretation and analysis, and submit two group reports.
(Note: this resource was added to OER Commons as part of a batch upload of over 2,200 records. If you notice an issue with the quality of the metadata, please let us know by using the 'report' button and we will flag it for consideration.)
This laboratory activity takes place in a computer lab that is equipped …
This laboratory activity takes place in a computer lab that is equipped with ArcGIS (we are currently using ArcGIS 9.3). Students will go to NASA's oil spill gallery website and download the full size image of the Deepwater Horizon oil slick from July 14th, 2010 taken by the Moderate Resolution Imaging Spectroradiometer (MODIS) on NASA's Aqua satellite at 1:55 p.m. Central Daylight Time. Their task is to to analyze the satellite imagery as an RGB composite and to experiment with reclassification techniques to subdivide the continuous raster dataset into user-defined numbers of ranges that will help visualize the oil spill. The activity introduces students to GIS software, remote sensing analysis, and sets up questions on spatial patterns and consequences of energy use.
(Note: this resource was added to OER Commons as part of a batch upload of over 2,200 records. If you notice an issue with the quality of the metadata, please let us know by using the 'report' button and we will flag it for consideration.)
To prepare for this lab, students read a section of the textbook …
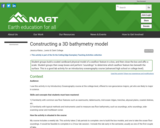
To prepare for this lab, students read a section of the textbook about observational techniques to measure the seafloor bathymetry as well as the occurrence of common sea floor features, such as seamounts, coastal shelves, mid-ocean ridges, and trenches. In the first lab, groups of students are provided with a bathymetric map, cutting board, sharp edges, and plenty of cardboard. They trace some contours from the map onto tracing paper, and then cut those out of the cardboard to construct a scale model of their given sea floor feature. They attach the sheets of cardboard with double-sided tape, and affix it to the bottom of a rigid box. The box lid has a grid of holes drilled into it. They determine the scale of the map (cm of the model to km in the ocean, for example), and affix the scale to the outside of the box. This concludes the first lab session.
In the second lab session, each team of students is provided with a box from an unknown team. The box is closed, and they do not know what ocean feature lay inside. They use bamboo skewers to take "soundings" at each of the drilled holes in the box lid, and mark their measurements on a piece of graph paper. Then they construct a contour map from the soundings, and try to identify the sea floor feature in the box from a global seafloor topography map that is hanging on a wall.
Students complete guided questions about the process of constructing their 3D scaled model and exploring the unknown ocean.
This web page from the National Snow and Ice Data Center contains …
This web page from the National Snow and Ice Data Center contains two related visualizations and supporting information about them. The first visualization gives an estimate of the percent contribution to sea level change since the 1990s from three contributors - small glaciers and ice caps, the Greenland Ice Sheet and the Antarctic Ice Sheet. The second visualization shows the cumulative contribution to sea level from small glaciers and ice caps plotted with the annual global surface air temperature anomaly.
Think science has all the answers? Think again. This course will use …
Think science has all the answers? Think again. This course will use real, authentic data to explore and investigate modern controversies in Earth Sciences. Use tide gauge records to understand how countries around the world attempt to protect themselves from tsunami events. Process seismic data to predict earthquake recurrence in the New Madrid seismic zone, right here in the breadbasket of the US. Sort through the millions of years of the geologic timeline to shed some light on what actually did, and did not, kill the dinosaurs. Finally, use global atmospheric data to understand how misrepresentation of data can be used to paint a distorted view of past, present, and future climate.
This Earth Exploration Toolbook chapter is a detailed computer-based exploration in which …
This Earth Exploration Toolbook chapter is a detailed computer-based exploration in which students learn how various climatic conditions impact the formations of sediment layers on the ocean floor. They analyze sediment core data from the Ross Ice Shelf in Antarctica for evidence of climate changes over time. In addition, they interact with various tools and animations throughout the activity, in particular the Paleontological Stratigraphic Interval Construction and Analysis Tool (PSICAT) that is used to construct a climate change model of a sediment core from core images.
In this video, Jonathan examines the biology of coral reefs and their …
In this video, Jonathan examines the biology of coral reefs and their importance to the marine ecosystem. Please see the accompanying lesson plan that discusses pH and ocean acidification for educational objectives, discussion points and classroom activities.
The Coriolis Effect is the deflection of moving objects when they are …
The Coriolis Effect is the deflection of moving objects when they are viewed in a rotating reference frame. In oceanography, we are most interested in how the Coriolis Effect moves winds and ocean currents on the rotating Earth. This activity is a simple demonstration for students to understand the Coriolis Effect by drawing arrows as they rotate a double-sided copy of the northern and southern hemispheres. My goal was to create something simple for students to use themselves to understand the Coriolis Effect.
This activity is designed to introduce students to the way in which …
This activity is designed to introduce students to the way in which thermohaline circulation and the biological pump influence the distribution of nutrients, oxygen, carbon, and radiocarbon in the Atlantic vs. Pacific Oceans.
(Note: this resource was added to OER Commons as part of a batch upload of over 2,200 records. If you notice an issue with the quality of the metadata, please let us know by using the 'report' button and we will flag it for consideration.)
This hands-on lab activity is designed to teach students about how density …
This hands-on lab activity is designed to teach students about how density differences, due to salinity, drive the flow of currents in the ocean. It also helps develop skills in performing and designing simple laboratory measurements; data entry, calculations and graph plotting in a spreadsheet; and comparing experimental data with a theoretical equation. Key words: ocean circulation; density driven flows; salinity; ocean density; thermohaline circulation.
No restrictions on your remixing, redistributing, or making derivative works. Give credit to the author, as required.
Your remixing, redistributing, or making derivatives works comes with some restrictions, including how it is shared.
Your redistributing comes with some restrictions. Do not remix or make derivative works.
Most restrictive license type. Prohibits most uses, sharing, and any changes.
Copyrighted materials, available under Fair Use and the TEACH Act for US-based educators, or other custom arrangements. Go to the resource provider to see their individual restrictions.