Our planet is becoming hot. In fact, Earth may be warming faster …
Our planet is becoming hot. In fact, Earth may be warming faster than ever before. This warming will challenge society throughout the 21st century. How do we cope with rising seas? How will we prepare for more intense hurricanes? How will we adapt to debilitating droughts and heat waves? Scientists are striving to improve predictions of how the environment will change and how it will impact humans. Earth in the Future: Predicting Climate Change and Its Impacts Over the Next Century is designed to provide the state of the art of climate science, the impact of warming on humans, as well as ways we can adapt. Every student will understand the challenges and opportunities of living in the 21st century.
This is a inquiry-driven class research project on a local environmental geochemistry …
This is a inquiry-driven class research project on a local environmental geochemistry question that is accomplished during three-hour laboratory sessions each week. Students are divided into groups that will share the responsibilities of collecting samples and data. Once the data is collected, it is shared among the entire class so that all students have the same data set. The class works on data presentation, preliminary analysis, and statistics together Then each student writes his/her own report separately.
Outcomes:
Laboratory skills -- Students have basic laboratory skills necessary to carry out a supervised geochemical study (e.g. can perform Gram titration of waters in field, can collect water samples using clean methods).
Quantitative methods -- Students can manipulate, sort, and transfer data in Excel and can create simple x-y plots and histograms to bring out trends in data.
Critical thinking -- Students can develop multiple hypotheses to explain trends in data and can design tests of these hypotheses.
(Note: this resource was added to OER Commons as part of a batch upload of over 2,200 records. If you notice an issue with the quality of the metadata, please let us know by using the 'report' button and we will flag it for consideration.)
This is an independent case study project completed in pairs. The students …
This is an independent case study project completed in pairs. The students should investigate an example of natural geochemistry and then use a poster format to share their findings with the class.
(Note: this resource was added to OER Commons as part of a batch upload of over 2,200 records. If you notice an issue with the quality of the metadata, please let us know by using the 'report' button and we will flag it for consideration.)
Students collect data for this term project starting with the first lab …
Students collect data for this term project starting with the first lab exercise and continuing throughout the semester. As each unit is covered in the text, class, and lab, students are directed to collect data relevant to their term project. For example: Topographic maps are covered at the start of the semester and students must locate their home; describe its location using the Public Land Survey, Universal Transverse Mercator, and Longitude-Latitude Systems; and describe the local topography. When natural hazards (flooding, slopes, earthquakes, volcanoes, and radon gas) are covered, students must use web resources (some of which are provided by the instructor at http://www2.ivcc.edu/phillips/geology/environmental_research.htm), local resources (such as the local fire chief, library, mayor, relatives, and neighbors), and personal observation to identify hazards and assess the risk they pose; these hazards are submitted as part of a lab assignment. The information collected is analyzed using the principles discussed in class and feedback is provided on pieces that are submitted throughout the semester. At the conclusion of the semester, students organize the collected information, add illustrations (maps and photos), analyze and evaluate the materials collected, and conclude the report with a discussion of how the area should be developed in the future based on the principles learned in the class.
The activity shows the students the immediate relevance of the material as it is covered, shows the students the types of information publicly available, and helps them develop critical analysis skills. The activity introducers students to basic geologic knowledge and shows them how to make use of it.
(Note: this resource was added to OER Commons as part of a batch upload of over 2,200 records. If you notice an issue with the quality of the metadata, please let us know by using the 'report' button and we will flag it for consideration.)
The Environment and the Earth class at the University of South Carolina …
The Environment and the Earth class at the University of South Carolina participated in a campus environmental service-learning project where students collected data lighting, water fixtures, recycling bins, and trash in five academic buildings.
(Note: this resource was added to OER Commons as part of a batch upload of over 2,200 records. If you notice an issue with the quality of the metadata, please let us know by using the 'report' button and we will flag it for consideration.)
Compiled by Suzanne Savanick, Science Education Resource Center. Based on Bixby et al. (2003), Ecology on Campus: Service Learning in Introductory Environmental Courses, Journal of College Science Teaching, v. 32, n.5, o, 327-331.
A great variety of processes affect the surface of the Earth. Topics …
A great variety of processes affect the surface of the Earth. Topics to be covered are production and movement of surficial materials; soils and soil erosion; precipitation; streams and lakes; groundwater flow; glaciers and their deposits. The course combines aspects of geology, climatology, hydrology, and soil science to present a coherent introduction to the surface of the Earth, with emphasis on both fundamental concepts and practical applications, as a basis for understanding and intelligent management of the Earth's physical and chemical environment.
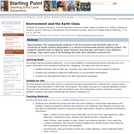
The learning objectives for this GIS exercise are to 1) understand rainfall …
The learning objectives for this GIS exercise are to 1) understand rainfall spatial variability and how to account for it when making areal-rainfall estimates, and 2) learn how ArcGIS can be used as a tool to determine areal averages, and 3) compare the advantages and drawbacks of the various techniques.
(Note: this resource was added to OER Commons as part of a batch upload of over 2,200 records. If you notice an issue with the quality of the metadata, please let us know by using the 'report' button and we will flag it for consideration.)
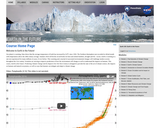
On July 4th, 1997, Mars Pathfinder landed at the mouth of Ares …
On July 4th, 1997, Mars Pathfinder landed at the mouth of Ares Vallis, a large channel that drains into the Chryse Planitia basin. While there remains a great deal to debate about the origin of the channels, one of the leading hypotheses at present is the idea that these features are the result of catastrophic flooding. If this is correct, then the plains where Pathfinder landed may be rich in debris eroded out of the Martian highlands across which the Ares Vallis channel passes, providing a golden combination -- a relatively safe landing site which still provides access to a wide variety of different rock types. [If you would like to learn more about the many Pathfinder results, explore the April, 1999 and January, 2000 issues of the journal Journal of Geophysical Research -- Planets (the green one) in the library.]
For the sake of this lab assignment you will hypothesize that the Ares Vallis and associated deposits were indeed produced by catastrophic flooding, and will use the information at your disposal to learn all you can about the putative flooding event.
(Note: this resource was added to OER Commons as part of a batch upload of over 2,200 records. If you notice an issue with the quality of the metadata, please let us know by using the 'report' button and we will flag it for consideration.)
Students make measurements of dam dimensions and water levels above and below …
Students make measurements of dam dimensions and water levels above and below a small, accessible earthen dam. They assess the soil texture in the field. They follow up by developing a simple flow net and estimating seepage rate as part of a problem set. They discuss their assumptions and the likely sources and magnitude of error.
(Note: this resource was added to OER Commons as part of a batch upload of over 2,200 records. If you notice an issue with the quality of the metadata, please let us know by using the 'report' button and we will flag it for consideration.)
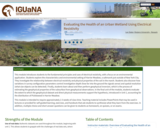
This module introduces students to the fundamental principles and uses of electrical …
This module introduces students to the fundamental principles and uses of electrical resistivity, with a focus on an environmental application. Students explore the characteristics and environmental setting of Harrier Meadow, a saltmarsh just outside of New York City. They investigate the relationship between electrical resistivity and physical properties of the soil in the marsh. Students also discover how variations in survey configuration parameters control investigation depth (how far into the ground the signals sense) and spatial resolution (what size objects can be detected). Finally, students learn about and then perform geophysical inversion, which is the process of estimating the geophysical properties of the subsurface from geophysical observations. In the final unit of the module, students evaluate the extent to which the geophysical dataset and direct physical measurements support the hypothesis, introduced in Unit 1, accounting for the distribution of Pickleweed in Harrier Meadow. This module is intended to require approximately 2-3 weeks of class time. Teaching material includes PowerPoints that may be used in lectures or provided for self-guided learning, exercises, and handouts that ask students to synthesize what they learn from the exercises. In addition, multiple choice and short answer questions can be given to students as homework, on quizzes, or on exams.
(Note: this resource was added to OER Commons as part of a batch upload of over 2,200 records. If you notice an issue with the quality of the metadata, please let us know by using the 'report' button and we will flag it for consideration.)
This assignment is best presented in two lab periods to represent the …
This assignment is best presented in two lab periods to represent the "before" and "after" scenarios of land use and their impact on hydrology. It requires documentation in map and/or airphoto form of land use in a specific watershed at two times: historical and modern. Historical USGS topographic maps from the 19th century were used in this case, along with digital orthophotos for the modern-day scenario. Some means of quantifying subareas within the watershed is also needed, either using software (ArcGIS) or transparent overlays and boxcounting from a translucent grid would work. For each of the sets of documentation: historical and modern, the students follow the USDA-NRCS TR55 empirical procedure to estimate event runoff depths and peak estimated discharge from the watershed. An area-weighted curve number (CN) is calculated based on tabulated categories of land use. Some judgment is involved in adapting the tabulated land use categories to the specific watershed used, and selecting an appropriate statistical average rainfall event to use. The sum of Darcy's Law calculations of discharge along streamtubes to a surface stream or estuary provides a groundwater discharge value over time for comparison. Each of these parts of the activity provides opportunities for the instructor to discuss uncertainties and sources of error. Note that although software allowing TR-55 analysis exists, it is simpler and more instructive to have students use the paper method and forms in the manual.
(Note: this resource was added to OER Commons as part of a batch upload of over 2,200 records. If you notice an issue with the quality of the metadata, please let us know by using the 'report' button and we will flag it for consideration.)
In Massachusetts, Manchester-by-the-Sea's wastewater treatment plant is located right on the coast. …
In Massachusetts, Manchester-by-the-Sea's wastewater treatment plant is located right on the coast. The town's water utility is working with the EPA's Climate Ready Water Utilities program to consider its adaptation options.
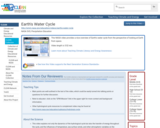
During this module students use multiple experiences (reading, video, the outdoors, a …
During this module students use multiple experiences (reading, video, the outdoors, a survey of their water footprints, writing, and lots of discussion) to examine how life today, in comparison to pre-industrial times, makes our connections to water virtually invisible. Students use the class's water footprint results to find out how agricultural and industrial water uses link us to people distant in both place and time. They weigh the consequences of these invisible connections in creating the lost sense of dependence and responsibility that typifies unsustainability. Students study the variability of water footprints within our class to help identify more sustainable personal choices. They consider the activity of a local watershed association to educate and involve people in improving the quality of local streams as a model of how community action can accomplish what individuals cannot.
(Note: this resource was added to OER Commons as part of a batch upload of over 2,200 records. If you notice an issue with the quality of the metadata, please let us know by using the 'report' button and we will flag it for consideration.)
In this activity students use published data from the Massachusetts Military Reservation …
In this activity students use published data from the Massachusetts Military Reservation to observe and predict mass transport parameters.
(Note: this resource was added to OER Commons as part of a batch upload of over 2,200 records. If you notice an issue with the quality of the metadata, please let us know by using the 'report' button and we will flag it for consideration.)
This Lecture Tutorial worksheet guides students through thinking about the effects humans …
This Lecture Tutorial worksheet guides students through thinking about the effects humans have on infiltration, and how that effects the duration and severity of floods. It is designed to be used in groups after a brief lecture introducing surface and ground water flow into a stream.
(Note: this resource was added to OER Commons as part of a batch upload of over 2,200 records. If you notice an issue with the quality of the metadata, please let us know by using the 'report' button and we will flag it for consideration.)
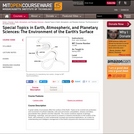
SSAC Geology of National Parks module/Geology of National Parks course. Students calculate …
SSAC Geology of National Parks module/Geology of National Parks course. Students calculate probabilities using USGS hydrograph data, a spreadsheet of daily stage heights, and the COUNTIF function.
(Note: this resource was added to OER Commons as part of a batch upload of over 2,200 records. If you notice an issue with the quality of the metadata, please let us know by using the 'report' button and we will flag it for consideration.)
Mark C. Rains (University of South Florida), David C. Shelley (National Parks Service) and Len Vacher (University of South Florida)
Cover page by Len Vacher, University of South Florida
In this lab, students measure a topographic and geologic cross-section across a …
In this lab, students measure a topographic and geologic cross-section across a floodplain by simple surveying and auguring techniques.
(Note: this resource was added to OER Commons as part of a batch upload of over 2,200 records. If you notice an issue with the quality of the metadata, please let us know by using the 'report' button and we will flag it for consideration.)
Students explore the USGS water website to identify the location of stream …
Students explore the USGS water website to identify the location of stream gauges on the Minnesota River and the types of data that can be retrieved from the website. They determine which data to download based on the area of interest in the exercise (St. Peter, MN) and import historical flood data into MS Excel. The students use a spreadsheet to rank each flood and calculate a recurrence interval for a given flood, then estimate the discharge and stage of the 100-year flood in St. Peter, MN. The final task is to establish a flood hazard zone on a topographic map of the city of St. Peter. Note: this exercise can be applied to almost any non-dammed river with two or more USGS gaging stations on it. Go to http://water.usgs.gov and select your state from the pull-down menu to view an interactive map of your state's rivers and gaging station locations.
(Note: this resource was added to OER Commons as part of a batch upload of over 2,200 records. If you notice an issue with the quality of the metadata, please let us know by using the 'report' button and we will flag it for consideration.)
No restrictions on your remixing, redistributing, or making derivative works. Give credit to the author, as required.
Your remixing, redistributing, or making derivatives works comes with some restrictions, including how it is shared.
Your redistributing comes with some restrictions. Do not remix or make derivative works.
Most restrictive license type. Prohibits most uses, sharing, and any changes.
Copyrighted materials, available under Fair Use and the TEACH Act for US-based educators, or other custom arrangements. Go to the resource provider to see their individual restrictions.