Water supply is a problem of worldwide concern: more than 1 billion …
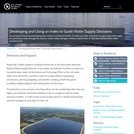
Water supply is a problem of worldwide concern: more than 1 billion people do not have reliable access to clean drinking water. Water is a particular problem for the developing world, but scarcity also impacts industrial societies. Water purification and desalination technology can be used to convert brackish ground water or seawater into drinking water. The challenge is to do so sustainably, with minimum cost and energy consumption, and with appropriately accessible technologies. This subject will survey the state-of-the-art in water purification by desalination and filtration. Fundamental thermodynamic and transport processes which govern the creation of fresh water from seawater and brackish ground water will be developed. The technologies of existing desalination systems will be discussed, and factors which limit the performance or the affordability of these systems will be highlighted. Energy efficiency will be a focus. Nanofiltration and emerging technologies for desalination will be considered. A student project in desalination will involve designing a well-water purification system for a village in Haiti.
In this activity the students calculate recurrence intervals for some historical crests …
In this activity the students calculate recurrence intervals for some historical crests on the Chippewa River and identify the 100-year flood plain in downtown Eau Claire. The students also evaluate the effect of a 20ft high stage event along the whole Chippewa River with the goal of showing how topography influences the size of the area affected by flooding events. The students also evaluate the effectiveness of a flood gate system located on campus.
(Note: this resource was added to OER Commons as part of a batch upload of over 2,200 records. If you notice an issue with the quality of the metadata, please let us know by using the 'report' button and we will flag it for consideration.)
This activity is a two-part (three week) lab in which students initially …
This activity is a two-part (three week) lab in which students initially develop a claim (non-scientific) and learn how to use evidence to support a claim. They then are provided with a scientific research question for which they need to make a claim supported with evidence from their own models (river/stream tables). Based on their results, they then ask a new research question, design the model, carry out their tests and report their results.
(Note: this resource was added to OER Commons as part of a batch upload of over 2,200 records. If you notice an issue with the quality of the metadata, please let us know by using the 'report' button and we will flag it for consideration.)
It's not easy to keep faucets flowing year-round in southwest Florida. To …
It's not easy to keep faucets flowing year-round in southwest Florida. To make sure their customers can get ample clean water at a good priceeven through dry seasonswater utility managers crafted a useful index to help them decide which water sources to use.
Some of the Viking images sent back from Mars in the 1970s …
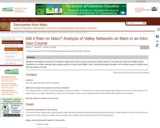
Some of the Viking images sent back from Mars in the 1970s show tantalizing evidence of dendritic valley networks in some of the oldest terrains on the planet. One of the big questions ever since has been whether it might have rained early in Mars history.
One of the ways of deciding whether the Mars valley networks might have been produced by rainfall is to find out how similar they are to valley networks on Earth, which we know are produced by rainfall. The standard method for analyzing drainage basins is comparison of the number of drainage segments per square kilometer (drainage density) and how extensively branched the network is (stream order).
In this exercise, students calculate stream order for valley segments mapped by Hynek and Phillips (2003) using MOC/MOLA data. Students then use data on valley segment length and drainage basin area from Hynek and Phillips (2003) to calculate drainage density. They compare stream order and drainage density for the Mars site with similar calculations for areas on Earth and evaluate the question of whether valley networks on Mars might be consistent with rainfall on an early Mars, and what the uncertainties and limitations are in their conclusions.
(Note: this resource was added to OER Commons as part of a batch upload of over 2,200 records. If you notice an issue with the quality of the metadata, please let us know by using the 'report' button and we will flag it for consideration.)
In this quantitative field activity, students collect field data on channel geometry, …
In this quantitative field activity, students collect field data on channel geometry, flow velocity, and bed materials. Using these data, they apply flow resistance equations and sediment transport relations to estimate the bankfull discharge and to determine if the flow is sufficient to mobilize the bed.
(Note: this resource was added to OER Commons as part of a batch upload of over 2,200 records. If you notice an issue with the quality of the metadata, please let us know by using the 'report' button and we will flag it for consideration.)
I find that when assigning lengthy readings for in-class discussion, it is …
I find that when assigning lengthy readings for in-class discussion, it is extremely helpful to guide students' preparation with specific questions, and incorporate these in worksheets that explicitly call for students to write out their responses before entering the classroom. These worksheets can provide some added structure for whole-class discussion, or can provide a specific agenda for review of the readings in small groups. Because these readings are more than a few years old, I have also found it useful to assign small groups of students to give brief reports that expand on and update the issues raised in the readings.
(Note: this resource was added to OER Commons as part of a batch upload of over 2,200 records. If you notice an issue with the quality of the metadata, please let us know by using the 'report' button and we will flag it for consideration.)
Students work with specified materials to create aqueduct components that can transport …
Students work with specified materials to create aqueduct components that can transport two liters of water across a short distance in their classroom. The design challenge is to create an aqueduct that can supply Aqueductis, a (hypothetical) Roman city, with clean water for private homes, public baths and fountains as well as crop irrigation.
Students gain a basic understanding of the properties of media soil, sand, …
Students gain a basic understanding of the properties of media soil, sand, compost, gravel and how these materials affect the movement of water (infiltration/percolation) into and below the surface of the ground. They learn about permeability, porosity, particle size, surface area, capillary action, storage capacity and field capacity, and how the characteristics of the materials that compose the media layer ultimately affect the recharging of groundwater tables. They test each type of material, determining storage capacity, field capacity and infiltration rates, seeing the effect of media size on infiltration rate and storage. Then teams apply the testing results to the design their own material mixes that best meet the design requirements. To conclude, they talk about how engineers apply what students learned in the activity about the infiltration rates of different soil materials to the design of stormwater management systems.
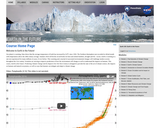
This is an in-class activity analyzing our drinking water reservoir, but would …
This is an in-class activity analyzing our drinking water reservoir, but would apply to any reservoir for which there are basic crest/elevation data and maps available.
(Note: this resource was added to OER Commons as part of a batch upload of over 2,200 records. If you notice an issue with the quality of the metadata, please let us know by using the 'report' button and we will flag it for consideration.)
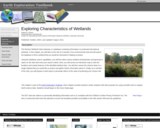
DATA: Worldwide Wetlands Inventory. TOOL: Ramsar International Wetlands Data Gateway. SUMMARY: Learn …
DATA: Worldwide Wetlands Inventory. TOOL: Ramsar International Wetlands Data Gateway. SUMMARY: Learn about wetlands around the world. Perform a series of searches to identify wetland areas that need protection.
(Note: this resource was added to OER Commons as part of a batch upload of over 2,200 records. If you notice an issue with the quality of the metadata, please let us know by using the 'report' button and we will flag it for consideration.)
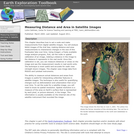
DATA: MODIS Imagery. TOOL: ImageJ. SUMMARY: Examine images of the Aral Sea …
DATA: MODIS Imagery. TOOL: ImageJ. SUMMARY: Examine images of the Aral Sea from 1973 through 2003. Use image analysis software to measure changes in the width and area of the freshwater lake over time.
(Note: this resource was added to OER Commons as part of a batch upload of over 2,200 records. If you notice an issue with the quality of the metadata, please let us know by using the 'report' button and we will flag it for consideration.)
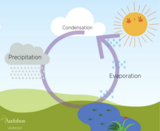
DATA: North American Regional Reanalysis (NARR). TOOL: FieldScope GIS. SUMMARY: Use an …
DATA: North American Regional Reanalysis (NARR). TOOL: FieldScope GIS. SUMMARY: Use an online GIS from the National Geographic Society, to investigate the relationship between precipitation, evaporation, and surface runoff.
(Note: this resource was added to OER Commons as part of a batch upload of over 2,200 records. If you notice an issue with the quality of the metadata, please let us know by using the 'report' button and we will flag it for consideration.)
DATA: Ocean Buoy Data, MODIS Images TOOLS: GoMOOS Online Graphing Tool SUMMARY: Learn about conditions that influence the spring phytoplankton bloom. Use an online graphing tool to predict the date of the bloom.
(Note: this resource was added to OER Commons as part of a batch upload of over 2,200 records. If you notice an issue with the quality of the metadata, please let us know by using the 'report' button and we will flag it for consideration.)
Rapid changes at Earth's surface, largely in response to human activity, have …
Rapid changes at Earth's surface, largely in response to human activity, have led to the realization that fundamental questions remain to be answered regarding the natural functioning of the Critical Zone, the thin veneer at Earth's surface where the atmosphere, lithosphere, hydrosphere and biosphere interact. EARTH 530 will introduce you to the basics necessary for understanding Earth surface processes in the Critical Zone through an integration of various scientific disciplines. Those who successfully complete EARTH 530 will be able to apply their knowledge of fundamental concepts of Earth surface processes to understanding outstanding fundamental questions in Critical Zone science and how their lives are intimately linked to Critical Zone health.
This video segment adapted from NASA's Goddard Space Flight Center discusses how …
This video segment adapted from NASA's Goddard Space Flight Center discusses how a drought can have negative effects locally, for example by increasing the number of forest fires, and also globally, for example by impacting air quality thousands of miles away.
Our planet is becoming hot. In fact, Earth may be warming faster …
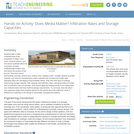
Our planet is becoming hot. In fact, Earth may be warming faster than ever before. This warming will challenge society throughout the 21st century. How do we cope with rising seas? How will we prepare for more intense hurricanes? How will we adapt to debilitating droughts and heat waves? Scientists are striving to improve predictions of how the environment will change and how it will impact humans. Earth in the Future: Predicting Climate Change and Its Impacts Over the Next Century is designed to provide the state of the art of climate science, the impact of warming on humans, as well as ways we can adapt. Every student will understand the challenges and opportunities of living in the 21st century.
Our planet is becoming hot. In fact, Earth may be warming faster …
Our planet is becoming hot. In fact, Earth may be warming faster than ever before. This warming will challenge society throughout the 21st century. How do we cope with rising seas? How will we prepare for more intense hurricanes? How will we adapt to debilitating droughts and heat waves? Scientists are striving to improve predictions of how the environment will change and how it will impact humans. Earth in the Future: Predicting Climate Change and Its Impacts Over the Next Century is designed to provide the state of the art of climate science, the impact of warming on humans, as well as ways we can adapt. Every student will understand the challenges and opportunities of living in the 21st century.
No restrictions on your remixing, redistributing, or making derivative works. Give credit to the author, as required.
Your remixing, redistributing, or making derivatives works comes with some restrictions, including how it is shared.
Your redistributing comes with some restrictions. Do not remix or make derivative works.
Most restrictive license type. Prohibits most uses, sharing, and any changes.
Copyrighted materials, available under Fair Use and the TEACH Act for US-based educators, or other custom arrangements. Go to the resource provider to see their individual restrictions.