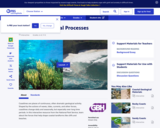
This interactive resource adapted from the National Park Service describes the many …
This interactive resource adapted from the National Park Service describes the many forces that affect shorelines, including tides, weathering, erosion, and deposition.
Climographs, graphic plots of monthly temperature and precipitation, allow students to see …
Climographs, graphic plots of monthly temperature and precipitation, allow students to see how differences in insolation at various locations affect rates of heating and cooling. In this activity, students use climographs to plot locations using latitude and longitude, calculate annual temperature ranges, and relate unequal rates of heating and cooling to climate variations. They will also construct climographs for two locations in New York, analyze them, and answer questions about their observations.
This professional development article identifies resources that show young learners (K-grade 5) …
This professional development article identifies resources that show young learners (K-grade 5) how scientists study Earth's climate and make predictions. The online lessons either allow students to collect and analyze data or learn about tools and technologies that make data collection possible. The lessons are aligned with national content standards for science education. The article appears in the free, online magazine Beyond Weather and the Water Cycle, which examines the recognized essential principles of climate literacy and the climate sciences for elementary teachers and their students.
This demonstration shows that similar-appearing lights can be distinctly different, suggesting that …
This demonstration shows that similar-appearing lights can be distinctly different, suggesting that the light emitted is generated in different ways. It requires some advance preparation/setup by the teacher and three recommended sources of orange light, that can be purchased at a hardware or department store. Includes extensions and additional background information on light generation in a section on underlying principles. This resource is from PUMAS - Practical Uses of Math and Science - a collection of brief examples created by scientists and engineers showing how math and science topics taught in K-12 classes have real world applications.
In this activity, students investigate sea level change during glacial maxima during …
In this activity, students investigate sea level change during glacial maxima during the Ice Ages, and learn how lowered sea level presented additional routes for intercontinental human migration. Summary background information, data and images supporting the activity are available on the Earth Update data site. To complete the activity, students will need to access the Space Update multimedia collection, which is available for download and purchase for use in the classroom.
This article describes common misconceptions held by elementary students about the history …
This article describes common misconceptions held by elementary students about the history of the polar regions, fossils, and geologic time. The article provides ideas for formative assessment, teaching strategies, and the National Science Education Standards.
This article describes common misconceptions held by elementary students about the cause …
This article describes common misconceptions held by elementary students about the cause of day and night and seasons. The article provides ideas for formative assessment, teaching strategies, and the National Science Education Standards.
This article from the free online magazine Beyond Weather and the Water …
This article from the free online magazine Beyond Weather and the Water Cycle provides appropriate science lessons for Grades K-5. The focus is on acquainting young learners with climate-change concepts that are not too complex for their grade level and will not frighten them. In each issue, the magazine develops articles around one of the seven essential principles of climate science. The author believes early lessons about water availability and extreme weather events will prepare students for complex climate concepts they will encounter in later grades.
This experimental activity is designed to develop a basic understanding of the …
This experimental activity is designed to develop a basic understanding of the relationship between temperature and pressure and that a barometer can be constructed to detect this relationship. Resources needed to build a simple barometer include a canning jar with metal lid ring, large balloon, a block of wood, ruler, a nail, wood glue, hammer and a screwdriver. The resource includes background information, teaching tips and questions to guide student discussion. This is chapter 6 of Meteorology: An Educator's Resource for Inquiry-Based Learning for Grades 5-9. The guide includes a discussion of learning science, the use of inquiry in the classroom, instructions for making simple weather instruments, and more than 20 weather investigations ranging from teacher-centered to guided and open inquiry investigations.
The purpose of this activity is to construct a model that will …
The purpose of this activity is to construct a model that will provide students with a visual representation of parts per billion. Students work in teams to construct cubes of different volumes and to compare them to get a feel for parts per million by volume and parts per billion by volume. The intended outcome is that students gain a feeling for the small quantities of gases, such as ozone, present in the Earth's atmosphere.
In this activity, students construct three-dimensional models from terrain information provided by …
In this activity, students construct three-dimensional models from terrain information provided by two-dimensional topographic maps. This will allow them to visualize how changes in elevation over a certain distance can be represented on a flat piece of paper that can be folded up and tucked away. Each group is responsible for constructing a model of Mount St. Helens 'before' and 'after', a depression, a stream, and a hill. Discussion questions related to the different representations are also included.
This example explains how contour mapping teaches both estimation and spatial visualization …
This example explains how contour mapping teaches both estimation and spatial visualization skills. To have experience visualizing 3-dimensional fields from a 2-dimensional map helps students throughout their mathematical career. This resource is from PUMAS - Practical Uses of Math and Science - a collection of brief examples created by scientists and engineers showing how math and science topics taught in K-12 classes have real world applications.
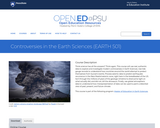
Think science has all the answers? Think again. This course will use …
Think science has all the answers? Think again. This course will use real, authentic data to explore and investigate modern controversies in Earth Sciences. Use tide gauge records to understand how countries around the world attempt to protect themselves from tsunami events. Process seismic data to predict earthquake recurrence in the New Madrid seismic zone, right here in the breadbasket of the US. Sort through the millions of years of the geologic timeline to shed some light on what actually did, and did not, kill the dinosaurs. Finally, use global atmospheric data to understand how misrepresentation of data can be used to paint a distorted view of past, present, and future climate.
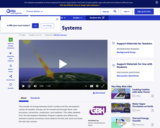
This video segment adapted from the Atmospheric Radiation Program explains the differences …
This video segment adapted from the Atmospheric Radiation Program explains the differences in the formation of tropical convective cloud systems over islands and over the ocean.
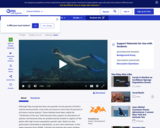
In this video segment, ZOOM guest Cassie takes us on a tour …
In this video segment, ZOOM guest Cassie takes us on a tour of the coral reef near her home in Key Largo, Florida, and points out some of its unique features.
In this activity, student teams identify the locations of coral reefs around …
In this activity, student teams identify the locations of coral reefs around the world, examine infrared satellite images of the Earth, and research the impacts that are threatening the survival of coral reefs. Each team creates a short oral presentation describing the coral reef they have researched. Students then plot on a composite map the locations where coral bleaching is occurring. Student worksheets, a teacher guide, and assessment rubric are included. This activity is part of Coastal Areas: Coral Reefs in Hot Water, part of the lesson series, The Potential Consequences of Climate Variability and Change.
The concepts that underlie the fourth essential principle of climate literacy ("Climate …
The concepts that underlie the fourth essential principle of climate literacy ("Climate varies over space and time through both natural and man-made processes.") are too complex for students in early and upper-level elementary school, but the foundational knowledge can be taught within existing curriculums and standards. This foundational knowledge will lead to understanding in later years. The author shows the correlation to the national science education standards, identifies misconceptions among elementary school students, suggests formative assessment probes, and identifies lessons and activities to make curriculum connections. The free, online magazine Beyond Weather and the Water Cycle is based on the seven essential principles of the climate sciences.
You can find statistics in every day life - this example explains …
You can find statistics in every day life - this example explains how to calculate the chance of a member of a committee is receiving a bribe. This resource is from PUMAS - Practical Uses of Math and Science - a collection of brief examples created by scientists and engineers showing how math and science topics taught in K-12 classes have real world applications.
In this activity, learners use crayons to draw conclusions about rocks and …
In this activity, learners use crayons to draw conclusions about rocks and the rock cycle. Learners form crayons ((which can be "weathered"--heated, compressed and cooled--like rocks) into models of sedimentary, metamorphic, and igneous rocks.
No restrictions on your remixing, redistributing, or making derivative works. Give credit to the author, as required.
Your remixing, redistributing, or making derivatives works comes with some restrictions, including how it is shared.
Your redistributing comes with some restrictions. Do not remix or make derivative works.
Most restrictive license type. Prohibits most uses, sharing, and any changes.
Copyrighted materials, available under Fair Use and the TEACH Act for US-based educators, or other custom arrangements. Go to the resource provider to see their individual restrictions.