This easy-to-understand video animation describes drought and explains the different categories of …
This easy-to-understand video animation describes drought and explains the different categories of drought used by the drought monitor. It discusses the effects of and contributions to drought, what the implications of the different drought levels are, and puts the drought maps into context to understand how the impacts vary geographically (e.g. drought in Nevada vs Kansas - one could affect tourism, the other agriculture). It also touches on how the development of maps/drought severity is determined and how it might vary geographically. The animation provides a basic overview of statistics and percentiles and the concept of '100 year events.'
Students will read primary scientific literature, work collaboratively, think critically, and utilize …
Students will read primary scientific literature, work collaboratively, think critically, and utilize GIS as a tool to visualize and quantify spatial and temporal changes in hydrological systems.
(Note: this resource was added to OER Commons as part of a batch upload of over 2,200 records. If you notice an issue with the quality of the metadata, please let us know by using the 'report' button and we will flag it for consideration.)
This activity introduces students to an actual data set that explores the …
This activity introduces students to an actual data set that explores the impacts of ocean acidification on tropical coral reef ecosystems. Students are first given a scenario for a field site in the Caribbean and are asked to design an experiment that answers the question: How will a decline in surface ocean pH by the 21st century impact tropical coral growth? Students then gather actual data (from coral images collected from the field site) to calculate calcification rates of different coral samples. Finally, students use the provided saturation state values to predict the extent to which coral calcification is expected to decline by the 21st century.
An interactive map based on four decades of satellite images helps residents, …
An interactive map based on four decades of satellite images helps residents, resource managers, and stewards of the land anticipate and plan for coastal change.
Given that humans historically have heavily used rivers and the lands along …
Given that humans historically have heavily used rivers and the lands along them for agriculture, transportation and other activities, how does human impact currently affect riparian ecosystems in a rural region? Students will address this question through several activities.
(Note: this resource was added to OER Commons as part of a batch upload of over 2,200 records. If you notice an issue with the quality of the metadata, please let us know by using the 'report' button and we will flag it for consideration.)
In this activity, students explore the web-based U.S. Forest Service Climate Change …
In this activity, students explore the web-based U.S. Forest Service Climate Change Atlas to learn about projected climate changes in their state and how suitable habitat for tree and bird species is projected to change by 2100.
This course explores the physical processes that control Earth's atmosphere, ocean, and …
This course explores the physical processes that control Earth's atmosphere, ocean, and climate. Quantitative methods for constructing mass and energy budgets. Topics include clouds, rain, severe storms, regional climate, the ozone layer, air pollution, ocean currents and productivity, the seasons, El Nio, the history of Earth's climate, global warming, energy, and water resources.
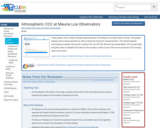
These graphs show carbon dioxide measurements at the Mauna Loa Observatory, Hawaii. …
These graphs show carbon dioxide measurements at the Mauna Loa Observatory, Hawaii. The graphs display recent measurements as well as historical long term measurements. The related website summarizes in graphs the recent monthly CO2, the full CO2 Record, the annual Mean CO2 Growth Rate, and gives links to detailed CO2 data for this location, which is one of the most important CO2 tracking sites in the world.
This is a multi-step activity that helps students measure, investigate, and understand …
This is a multi-step activity that helps students measure, investigate, and understand the increase in atmospheric CO2 and the utility of carbon offsets. It also enables students to understand that carbon offsets, through reforestation, are not sufficient to balance increases in atmospheric C02 concentration.
This course provides a detailed overview of the chemical transformations that control …
This course provides a detailed overview of the chemical transformations that control the abundances of key trace species in the Earth's atmosphere. Emphasizes the effects of human activity on air quality and climate. Topics include photochemistry, kinetics, and thermodynamics important to the chemistry of the atmosphere; stratospheric ozone depletion; oxidation chemistry of the troposphere; photochemical smog; aerosol chemistry; and sources and sinks of greenhouse gases and other climate forcers.
This is a figure from the 2007 IPCC Assessment Report 4 on …
This is a figure from the 2007 IPCC Assessment Report 4 on atmospheric concentrations of carbon dioxide, methane and nitrous oxide over the last 10,000 years (large panels) and since 1750 (inset panels).
This is a photo essay linked to a New York Times story …
This is a photo essay linked to a New York Times story about climate-related stressors on forests -- including mountain pine beetles, forest fires, forest clearance, and ice storms -- and the importance of protecting forests as an important carbon sink.
This video shows where and how ice cores are extracted from the …
This video shows where and how ice cores are extracted from the West Antarctic Ice Sheet. The cores are cut, packaged, flown to the ice core storage facility in Denver, further sliced into samples, and shipped to labs all over the world where scientists use them to study indicators of climate change from the past.
Oyster-Acidifying oceans dramatically stunt the growth of already threatened shellfish. This audio …
Oyster-Acidifying oceans dramatically stunt the growth of already threatened shellfish. This audio slideshow and video features scientists from Bodega Marine Lab and research on shellfish in Tomales Bay, CA.
Urban Australia confronts numerous challenges in the 21st century: climate change, housing, …
Urban Australia confronts numerous challenges in the 21st century: climate change, housing, transport, greenspace, social inequality, and governance, among them. While state and local governments wrestle with these issues, they are continent wide and require national leadership, direction and participation. As a highly urbanised country without a national approach to urban policy, Australia is an outlier.
Contributors to this book argue that this policy gap needs to be addressed. They ask: How have productive, sustainable and liveable cities so far been enhanced? Where have aspirations fallen short or produced negative outcomes? And what approaches are emerging to challenge existing and devise new urban policy settings?
In the face of ongoing crises and escalating change, the need for policy to quickly transform urban Australia is daunting. Problems, wicked in their complexity, require innovative, ethical solutions. This book offers new ideas that challenge policy orthodoxy.
This is a laboratory activity in which students will compare the amount …
This is a laboratory activity in which students will compare the amount of carbon dioxide in four different sources of gas and determine the carbon dioxide contribution from automobiles. They test ambient air, human exhalation, automobile exhaust, and nearly pure carbon dioxide from a vinegar/baking soda mixture.
Ever since there have been babies, there has been a need to …
Ever since there have been babies, there has been a need to carry those babies. The cradleboard is art meets science and function for parents and children. This unique design was made for easy transport and care of a child.
In this video, NOAA's Deke Arndt, Chief of the Climate Monitoring Branch …
In this video, NOAA's Deke Arndt, Chief of the Climate Monitoring Branch at the National Climatic Data Center, recaps the temperature and precipitation data for the continental US in summer 2012. It describes how these conditions have led to drought and reduced crop yields.
No restrictions on your remixing, redistributing, or making derivative works. Give credit to the author, as required.
Your remixing, redistributing, or making derivatives works comes with some restrictions, including how it is shared.
Your redistributing comes with some restrictions. Do not remix or make derivative works.
Most restrictive license type. Prohibits most uses, sharing, and any changes.
Copyrighted materials, available under Fair Use and the TEACH Act for US-based educators, or other custom arrangements. Go to the resource provider to see their individual restrictions.