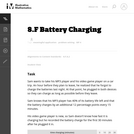
This task describes two linear functions using two different representations. To draw …
This task describes two linear functions using two different representations. To draw conclusions about the quantities, students have to find a common way of describing them. We have presented three solutions (1) Finding equations for both functions. (2) Using tables of values. (3) Using graphs.
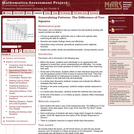
This lesson unit is intended to help you assess how well students …
This lesson unit is intended to help you assess how well students working with square numbers are able to: choose an appropriate, systematic way to collect and organize data, examining the data for patterns; describe and explain findings clearly and effectively; generalize using numerical, geometrical, graphical and/or algebraic structure; and explain why certain results are possible/impossible, moving towards a proof.
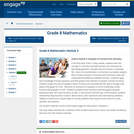
In the first topic of this 15 day module, students learn the …
In the first topic of this 15 day module, students learn the concept of a function and why functions are necessary for describing geometric concepts and occurrences in everyday life. Once a formal definition of a function is provided, students then consider functions of discrete and continuous rates and understand the difference between the two. Students apply their knowledge of linear equations and their graphs from Module 4 to graphs of linear functions. Students inspect the rate of change of linear functions and conclude that the rate of change is the slope of the graph of a line. They learn to interpret the equation y=mx+b as defining a linear function whose graph is a line. Students compare linear functions and their graphs and gain experience with non-linear functions as well. In the second and final topic of this module, students extend what they learned in Grade 7 about how to solve real-world and mathematical problems related to volume from simple solids to include problems that require the formulas for cones, cylinders, and spheres.
Find the rest of the EngageNY Mathematics resources at https://archive.org/details/engageny-mathematics.
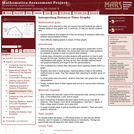
This lesson unit is intended to help teachers assess how well students …
This lesson unit is intended to help teachers assess how well students are able to interpret distanceĐtime graphs and, in particular, to help you identify students who: interpret distanceĐtime graphs as if they are pictures of situations rather than abstract representations of them; and have difficulty relating speeds to slopes of these graphs.
This lesson unit is intended to help teahcers assess how well students …
This lesson unit is intended to help teahcers assess how well students are able to interpret speed as the slope of a linear graph and translate between the equation of a line and its graphical representation.
This lesson unit is intended to help you assess how well students …
This lesson unit is intended to help you assess how well students use algebra in context, and in particular, how well students: explore relationships between variables in everyday situations; find unknown values from known values; find relationships between pairs of unknowns, and express these as tables and graphs; and find general relationships between several variables, and express these in different ways by rearranging formulae.
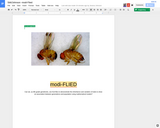
Students will breed fruit flies through several generations and record their data …
Students will breed fruit flies through several generations and record their data using mathematical models in order to demonstrate the inheritance of trait variations.
(Nota: Esta es una traducción de un recurso educativo abierto creado por …
(Nota: Esta es una traducción de un recurso educativo abierto creado por el Departamento de Educación del Estado de Nueva York (NYSED) como parte del proyecto "EngageNY" en 2013. Aunque el recurso real fue traducido por personas, la siguiente descripción se tradujo del inglés original usando Google Translate para ayudar a los usuarios potenciales a decidir si se adapta a sus necesidades y puede contener errores gramaticales o lingüísticos. La descripción original en inglés también se proporciona a continuación.)
En el primer tema de este módulo de 15 días, los estudiantes aprenden el concepto de una función y por qué las funciones son necesarias para describir conceptos geométricos y ocurrencias en la vida cotidiana. Una vez que se proporciona una definición formal de una función, los estudiantes consideran funciones de tarifas discretas y continuas y comprenden la diferencia entre los dos. Los estudiantes aplican su conocimiento de las ecuaciones lineales y sus gráficos del módulo 4 a los gráficos de funciones lineales. Los estudiantes inspeccionan la tasa de cambio de funciones lineales y concluyen que la tasa de cambio es la pendiente de la gráfica de una línea. Aprenden a interpretar la ecuación y = mx+b como definir una función lineal cuyo gráfico es una línea. Los estudiantes comparan funciones lineales y sus gráficos y también obtienen experiencia con funciones no lineales. En el segundo y último tema de este módulo, los estudiantes extienden lo que aprendieron en el grado 7 sobre cómo resolver los problemas del mundo real y las matemáticas relacionadas con el volumen de sólidos simples para incluir problemas que requieren las fórmulas para conos, cilindros y esferas.
Encuentre el resto de los recursos matemáticos de Engageny en https://archive.org/details/engageny-mathematics.
English Description: In the first topic of this 15 day module, students learn the concept of a function and why functions are necessary for describing geometric concepts and occurrences in everyday life. Once a formal definition of a function is provided, students then consider functions of discrete and continuous rates and understand the difference between the two. Students apply their knowledge of linear equations and their graphs from Module 4 to graphs of linear functions. Students inspect the rate of change of linear functions and conclude that the rate of change is the slope of the graph of a line. They learn to interpret the equation y=mx+b as defining a linear function whose graph is a line. Students compare linear functions and their graphs and gain experience with non-linear functions as well. In the second and final topic of this module, students extend what they learned in Grade 7 about how to solve real-world and mathematical problems related to volume from simple solids to include problems that require the formulas for cones, cylinders, and spheres.
Find the rest of the EngageNY Mathematics resources at https://archive.org/details/engageny-mathematics.
The intent of clarifying statements is to provide additional guidance for educators …
The intent of clarifying statements is to provide additional guidance for educators to communicate the intent of the standard to support the future development of curricular resources and assessments aligned to the 2021 math standards. Clarifying statements can be in the form of succinct sentences or paragraphs that attend to one of four types of clarifications: (1) Student Experiences; (2) Examples; (3) Boundaries; and (4) Connection to Math Practices.
In this activity, students explore phase change at a molecular level. They …
In this activity, students explore phase change at a molecular level. They trace the path of an atom to view intermolecular interactions and investigate how temperature relates to phase change. Upon activity completion, students will be able to give examples of phase change, explain how the input of energy into a system affects the state of matter, and describe how both latent heat and evaporative cooling play a role in changes of phase.
This course will place a emphasis on the continued study of integers, …
This course will place a emphasis on the continued study of integers, order of operations, variables, expressions, equations and polynomials. You will solve equations, write and solve proportions, explore polynomials and build an understanding of important mathematical properties.
Measure relative humidity in the air using a simple device made of …
Measure relative humidity in the air using a simple device made of a temperature sensor, a plastic bottle, and some clay. Electronically plot the data you collect on graphs to analyze and learn from it. Experiment with different materials and different room temperatures in order to explore what affects humidity.
Learn how and when the Eastern Shoshone came to Wyoming, what are …
Learn how and when the Eastern Shoshone came to Wyoming, what are the Shoshone values, and what are the people of the Eastern Shoshone like? In the accompanying lessons plans (found in the Support Materials), students will gain an understanding of the Fort Bridger Treaty of 1868 including its importance to the state of Wyoming and the Eastern Shoshone Tribe in 1868 and today. The American Bison, or Buffalo as preferred by most tribes, has a significant existence among the Native American people. For thousands of years, the great American Buffalo roamed the Great Plains, migrating from north to south, searching for areas on which to thrive. The Shoshone people depended on the buffalo for many things that included food, clothing, and shelter. Every part of the buffalo was used and provided for the people.
LEARNING OBJECTIVES:
Students will study (Highlight, paraphrase and report) the Treaty of 1868 between the Eastern Shoshone Tribe and the United States Government. Students will learn about the Eastern Shoshone people through the use of research and technology. Students will understand that the history of the Shoshone people in the Wind River Mountains dates back thousands of years. Students will understand that the circle of life continues in a perpetual cycle and is passed on through oral tradition. These stories often taught a lesson to young people. Students will understand the indigenous perspective of interconnectedness. Students will understand how bison populations were devastated by western expansion. Students will learn how to construct, read, compare and analyze different population graphs. Students will understand how the diets of the Shoshone people varied depending on the areas in which they lived. Students will acquire knowledge of the Wind River Reservation communities and be able to identify these locations on a map. Students will be able to further describe how their culture has shaped them. Students will be able to define the concept of culture. Students will be able to explain some of the attributes of culture.
No restrictions on your remixing, redistributing, or making derivative works. Give credit to the author, as required.
Your remixing, redistributing, or making derivatives works comes with some restrictions, including how it is shared.
Your redistributing comes with some restrictions. Do not remix or make derivative works.
Most restrictive license type. Prohibits most uses, sharing, and any changes.
Copyrighted materials, available under Fair Use and the TEACH Act for US-based educators, or other custom arrangements. Go to the resource provider to see their individual restrictions.