In this activity, students examine how to grow plants the most efficiently. …
In this activity, students examine how to grow plants the most efficiently. They imagine that they are designing a biofuels production facility and need to know how to efficiently grow plants to use in this facility. As a means of solving this design problem, they plan a scientific experiment in which they investigate how a given variable (of their choice) affects plant growth. They then make predictions about the outcomes and record their observations after two weeks regarding the condition of the plants' stem, leaves and roots. They use these observations to guide their solution to the engineering design problem. The biological processes of photosynthesis and transpiration are briefly explained to help students make informed decisions about planning and interpreting their investigation and its results.
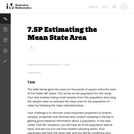
This task introduces the fundamental statistical ideas of using data summaries (statistics) …
This task introduces the fundamental statistical ideas of using data summaries (statistics) from random samples to draw inferences (reasoned conclusions) about population characteristics (parameters). In the task built around an election poll scenario, the population is the entire seventh grade class, the unknown characteristic (parameter) of interest is the proportion of the class members voting for a specific candidate, and the sample summary (statistic) is the observed proportion of voters favoring the candidate in a random sample of class members.
This lesson unit is intended to help you assess how well students …
This lesson unit is intended to help you assess how well students are able to: solve simple problems involving ratio and direct proportion; choose an appropriate sampling method; and collect discrete data and record them using a frequency table.
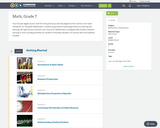
The task is designed to show that random samples produce distributions of …
The task is designed to show that random samples produce distributions of sample means that center at the population mean, and that the variation in the sample means will decrease noticeably as the sample size increases. Random sampling (like mixing names in a hat and drawing out a sample) is not a new idea to most students, although the terminology is likely to be new.
This lesson unit addresses common misconceptions relating to probability of simple and …
This lesson unit addresses common misconceptions relating to probability of simple and compound events. The lesson will help you assess how well students understand concepts of: Equally likely events; randomness; and sample sizes.
Four full-year digital course, built from the ground up and fully-aligned to …
Four full-year digital course, built from the ground up and fully-aligned to the Common Core State Standards, for 7th grade Mathematics. Created using research-based approaches to teaching and learning, the Open Access Common Core Course for Mathematics is designed with student-centered learning in mind, including activities for students to develop valuable 21st century skills and academic mindset.
Samples and ProbabilityType of Unit: ConceptualPrior KnowledgeStudents should be able to:Understand the …
Samples and ProbabilityType of Unit: ConceptualPrior KnowledgeStudents should be able to:Understand the concept of a ratio.Write ratios as percents.Describe data using measures of center.Display and interpret data in dot plots, histograms, and box plots.Lesson FlowStudents begin to think about probability by considering the relative likelihood of familiar events on the continuum between impossible and certain. Students begin to formalize this understanding of probability. They are introduced to the concept of probability as a measure of likelihood, and how to calculate probability of equally likely events using a ratio. The terms (impossible, certain, etc.) are given numerical values. Next, students compare expected results to actual results by calculating the probability of an event and conducting an experiment. Students explore the probability of outcomes that are not equally likely. They collect data to estimate the experimental probabilities. They use ratio and proportion to predict results for a large number of trials. Students learn about compound events. They use tree diagrams, tables, and systematic lists as tools to find the sample space. They determine the theoretical probability of first independent, and then dependent events. In Lesson 10 students identify a question to investigate for a unit project and submit a proposal. They then complete a Self Check. In Lesson 11, students review the results of the Self Check, solve a related problem, and take a Quiz.Students are introduced to the concept of sampling as a method of determining characteristics of a population. They consider how a sample can be random or biased, and think about methods for randomly sampling a population to ensure that it is representative. In Lesson 13, students collect and analyze data for their unit project. Students begin to apply their knowledge of statistics learned in sixth grade. They determine the typical class score from a sample of the population, and reason about the representativeness of the sample. Then, students begin to develop intuition about appropriate sample size by conducting an experiment. They compare different sample sizes, and decide whether increasing the sample size improves the results. In Lesson 16 and Lesson 17, students compare two data sets using any tools they wish. Students will be reminded of Mean Average Deviation (MAD), which will be a useful tool in this situation. Students complete another Self Check, review the results of their Self Check, and solve additional problems. The unit ends with three days for students to work on Gallery problems, possibly using one of the days to complete their project or get help on their project if needed, two days for students to present their unit projects to the class, and one day for the End of Unit Assessment.
Students begin to develop intuition about appropriate sample size by conducting an …
Students begin to develop intuition about appropriate sample size by conducting an experiment. They compare different sample sizes and whether increasing the sample size improves the results.Key ConceptsSampling is a way to discover unknown characteristics about a population. The size of the sample is important in determining the accuracy of the results. Ratio and proportion are used to compare the sample to the population.Goals and Learning ObjectivesStudents will use sampling to determine the number of different color marbles in a jar.Students will explore sample size compared to population size.
Students are introduced to the concept of sampling as a method of …
Students are introduced to the concept of sampling as a method of determining characteristics of a population. They consider how a sample can be random or biased, and think of methods for randomly sampling a population to ensure that it is representative.The idea of sampling is connected to probability; a relatively small set of data (a random sample/number of trials) can be used to generalize about a population (or determine probability). A larger sample (more trials) will give more confidence in the conclusions, but how large of a sample is needed?Students also discuss what random means and how to generate a random sample. Random samples are compared to biased samples and give insight into how statistics can be misleading (intentionally or otherwise).Key ConceptsRandom samples are related to probability. In probability, the number of trials is a sample used to generalize about the probability of an event. The results in probability are random if we are looking at equally likely outcomes. If a data sample is not random, the conclusions about the population will not reflect it.Terminology introduced in this lesson:population: the entire set of objects that can be considered when asking a statistical questionsample: a subset of a population; can be random, where each object in the population is equally likely to be in the sample, or biased, where not every object in the population is equally likely to be in the sampleGoals and Learning ObjectivesIntroduce sampling as a method to generalize about a population.Discuss the concept of a random sample versus a biased sample.Determine methods to generate random samples.Understand that biased samples are sometimes used to mislead.SWD: Some students with disabilities will benefit from a preview of the goals in this lesson. Students can highlight the critical features and/or concepts and will help them to pay close attention to salient information.
The intent of clarifying statements is to provide additional guidance for educators …
The intent of clarifying statements is to provide additional guidance for educators to communicate the intent of the standard to support the future development of curricular resources and assessments aligned to the 2021 math standards. Clarifying statements can be in the form of succinct sentences or paragraphs that attend to one of four types of clarifications: (1) Student Experiences; (2) Examples; (3) Boundaries; and (4) Connection to Math Practices.
In this lesson designed to enhance literacy skills, students learn about population …
In this lesson designed to enhance literacy skills, students learn about population sampling by watching how a Native American tribe measures the number of fish in their lake.
Students will explore the overarching question, is the internet trustworthy?, while expanding …
Students will explore the overarching question, is the internet trustworthy?, while expanding their knowledge of statistics and comparing data sets. They will compare two data sets as well as determine the accuracy or bias of data representations shown on the internet. Students will then have the opportunity to apply their knowledge while creating their own visual representations for data they personally collected regarding the trustworthiness of the internet. The module concludes with a peer showcase and the post-assessment.
The growing number of electronics that are becoming obsolete is staggering. The …
The growing number of electronics that are becoming obsolete is staggering. The responsible disposal of these materials remains to be a highly debated topic and is one that does not have an easy answer. In this problem-based learning module, students will research this growing issue and provide them opportunities to determine what actions to take. Students will then take their findings and use their research data as evidence to support their position. Groups will create a finished product in the form of a speech, radio broadcast, presentation or persuasive essay to help solve this problem.
In this problem-based learning module students will connect these standards to their …
In this problem-based learning module students will connect these standards to their personal life by completing a random sample from their environment in the area of careers to investigate to see if their own career is environmentally challenged. Students will work independently as well as with a partner. Students will also complete a reflection in the form of a final product to make an inference and draw a conclusion about the population of their area in relation to careers. The final product will be presented to their peers and teachers, but also can be exhibited to their families. This blended module includes teacher-led instruction, student-led stations, partner comparisons and technology integrated investigations.
Students use DNA profiling to determine who robbed a bank. After they …
Students use DNA profiling to determine who robbed a bank. After they learn how the FBI's Combined DNA Index System (CODIS) is used to match crime scene DNA with tissue sample DNA, students use CODIS principles and sample DNA fragments to determine which of three suspects matches evidence obtain at a crime location. They communicate their results as if they were biomedical engineers reporting to a police crime scene investigation.
No restrictions on your remixing, redistributing, or making derivative works. Give credit to the author, as required.
Your remixing, redistributing, or making derivatives works comes with some restrictions, including how it is shared.
Your redistributing comes with some restrictions. Do not remix or make derivative works.
Most restrictive license type. Prohibits most uses, sharing, and any changes.
Copyrighted materials, available under Fair Use and the TEACH Act for US-based educators, or other custom arrangements. Go to the resource provider to see their individual restrictions.