This is a collection of five short videos that show how climate …
This is a collection of five short videos that show how climate change is affecting fishing, native populations and access for the oil and gas industry in the Arctic. The videos include personal reflections by writers Andrew C. Revkin and Simon Romero, scientists, and residents about their experience of the impacts of the climate change in the Arctic.
This set of interactive data visualizations show the weather and climate events …
This set of interactive data visualizations show the weather and climate events that have had the greatest economic impact on the US from 1980 to 2016.
The purpose of this resource is to quantitatively evaluate the accuracy of …
The purpose of this resource is to quantitatively evaluate the accuracy of a classification system. Students sort birds into three possible classes based on each bird's beak: carnivores, herbivores, and omnivores. Students compare their answers with a given set of validation data.
In this series of activities students investigate the effects of black carbon …
In this series of activities students investigate the effects of black carbon on snow and ice melt in the Arctic. The lesson begins with an activity that introduces students to the concept of thermal energy and how light and dark surfaces reflect and absorb radiant energy differently. To help quantify the relationship between carbon and ice melt, the wet lab activity has students create ice samples both with and without black carbon and then compare how they respond to radiant energy while considering implications for the Arctic.
In this activity, students develop an understanding of the relationship between natural …
In this activity, students develop an understanding of the relationship between natural phenomena, weather, and climate change: the study known as phenology. In addition, they learn how cultural events are tied to the timing of seasonal events. Students brainstorm annual natural phenomena that are tied to seasonal weather changes. Next, they receive information regarding the Japanese springtime festival of Hanami, celebrating the appearance of cherry blossoms. Students plot and interpret average bloom date data from over the past 1100 years.
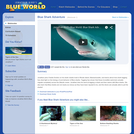
In this video, Jonathan joins Charlie Donilon on his shark charter boat …
In this video, Jonathan joins Charlie Donilon on his shark charter boat in Rhode Island, Massachusetts, and learns about how shark tagging has shed light on the biology of and behavior of Blue sharks. Tagging has shown that these incredible swimmers actually migrate completely across the Atlantic ocean. Jonathan tries his hand at tagging a shark and then swims with Blue sharks. We also learn that Blue sharks are not nearly as vicious as they have been reputed to be, and the divers are actually able to pet the sharks! Please see the accompanying study guide for educational objectives and discussion points.
In this video segment adapted from A Science Odyssey, learn about bubonic …
In this video segment adapted from A Science Odyssey, learn about bubonic plague and how city officials in San Francisco tried to contain its spread in the early 1900s..
This is an lesson about spectrographs. Learners will build and decorate their …
This is an lesson about spectrographs. Learners will build and decorate their own spectrographs using simple materials and holographic diffraction gratings. After building the spectrographs, they observe the spectra of different light sources. Requires advance preparation to spray-paint the inside of the containers black the day before construction. The activity is part of Project Spectra, a science and engineering program for middle-high school students, focusing on how light is used to explore the Solar System.
This set of animations and interactive simulations from the Byrd Polar Research …
This set of animations and interactive simulations from the Byrd Polar Research Center at Ohio State University helps students develop an understanding of models used to understand the Earth system. Students consider the types of data that need to be included in a climate model, looking at inputs, outputs, and variables. The animations show how data is calculated for grid cells and assembled into a comprehensive model.
This video segment, from the 'Earth: The Operators' Manual' featuring climate expert …
This video segment, from the 'Earth: The Operators' Manual' featuring climate expert Richard Alley, shows how ice cores stored at the National Ice Core Lab provide evidence that ancient ice contains records of Earth's past climate - specifically carbon dioxide and temperature.
This video is narrated by climate scientist Richard Alley. It examines studies …
This video is narrated by climate scientist Richard Alley. It examines studies US Air Force conducted over 50 years ago on the warming effects of CO2 in the atmosphere and how that could impact missile warfare. The video then focuses on the Franz Josef glacier in New Zealand; the glacier is used to demonstrate a glacier's formation, depth of snow fall in the past, and understand atmospheric gases and composition during the last Ice Age. Supplemental resources are available through the website.
C-ROADS is a simplified version of a climate simulator. Its primary purpose …
C-ROADS is a simplified version of a climate simulator. Its primary purpose is to help users understand the long-term climate effects (CO2 concentrations, global temperature, sea level rise) of various customized actions to reduce fossil fuel CO2 emissions, reduce deforestation, and grow more trees. Students can ask multiple, customized what-if questions and understand why the system reacts as it does.
Students conduct a greenhouse gas emission inventory for their college or university …
Students conduct a greenhouse gas emission inventory for their college or university as a required part of the American College and University Presidents Climate Commitment.
This PBS video shows how Klaus Lackner, a geophysicist at Columbia University, …
This PBS video shows how Klaus Lackner, a geophysicist at Columbia University, is trying to tackle the problem of rising atmospheric CO2 levels by using an idea inspired by his daughter's 8th-grade science fair project. The video examines the idea of pulling CO2 out of the atmosphere via a passive chemical process.
This activity from NOAA Earth System Research Laboratory introduces students to the …
This activity from NOAA Earth System Research Laboratory introduces students to the scientific understanding of the greenhouse effect and the carbon cycle. The activity leads them through several interactive tasks to investigate recent trends in atmospheric carbon dioxide. Students analyze scientific data and use scientific reasoning to determine the causes responsible for these recent trends. By studying carbon cycle science in a visual and interactive manner, students can learn firsthand about the reasons behind our changing climate.
This interactive animation focuses on the carbon cycle and includes embedded videos …
This interactive animation focuses on the carbon cycle and includes embedded videos and captioned images to provide greater clarification and detail of the cycle than would be available by a single static visual alone.
No restrictions on your remixing, redistributing, or making derivative works. Give credit to the author, as required.
Your remixing, redistributing, or making derivatives works comes with some restrictions, including how it is shared.
Your redistributing comes with some restrictions. Do not remix or make derivative works.
Most restrictive license type. Prohibits most uses, sharing, and any changes.
Copyrighted materials, available under Fair Use and the TEACH Act for US-based educators, or other custom arrangements. Go to the resource provider to see their individual restrictions.