This activity is designed to support a variety of STEM concepts: scientific …
This activity is designed to support a variety of STEM concepts: scientific method, making predictions, gathering and analyzing data, and developing conclusions based on experimentation. This activity draws on active student engagement, and is useful in many STEM content areas.
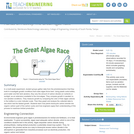
In a multi-week experiment, student groups gather data from the photobioreactors that …
In a multi-week experiment, student groups gather data from the photobioreactors that they build to investigate growth conditions that make algae thrive best. Using plastic soda bottles, pond water and fish tank aerators, they vary the amount of carbon dioxide (or nutrients or sunlight, as an extension) available to the microalgae. They compare growth in aerated vs. non-aerated conditions. They measure growth by comparing the color of their algae cultures in the bottles to a color indicator scale. Then they graph and analyze the collected data to see which had the fastest growth. Students learn how plants biorecycle carbon dioxide into organic carbon (part of the carbon cycle) and how engineers apply their understanding of this process to maximize biofuel production.
This textbook provides an introduction to the MATLAB programming language for first-year …
This textbook provides an introduction to the MATLAB programming language for first-year mechanical engineering students enrolled in ME 160. Designed to follow the content taught in class, this book provides a supplement to in-class learning that is presented at a level that is understandable to a student with no experience coding before coming to Iowa State University.
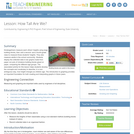
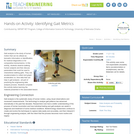
SYNOPSIS: In this lesson, students reflect on their personal energy use, make …
SYNOPSIS: In this lesson, students reflect on their personal energy use, make a bar graph to analyze data from the class, and create a conservation poster for display.
SCIENTIST NOTES: This lesson is suitable to build the capacity of students to understand energy sources and what they can power, to compute and audit their daily energy consumption, to share their energy footprint in group activities, and to raise awareness on energy consumption to a wide audience by creating a conservation poster. This lesson has passed our science review process and is recommended for classroom use.
POSITIVES: -This lesson includes using a spreadsheet to create a bar graph. This may be the first time students learn this skill. -Creating a conservation poster is a great way for students to feel empowered to take immediate climate action.
ADDITIONAL PREREQUISITES: -This is lesson 2 of 6 in our 3rd-5th grade Renewable Energy unit. -When you are collecting data for the spreadsheets and graphs, some students may respond that they spent 1,440 minutes using energy (which is the total amount of minutes in a day) due to use of electricity for refrigerators or the heating and cooling of their homes. Although true, having multiple data points of 1,440 minutes is not useful. Have them come up with a lower estimate.
DIFFERENTIATION: -Some students may have difficulty with data entry when adding numbers to their spreadsheet. It may be best to create groups of students so they can check each other's progress to make sure it is correct. -It may be best to allow students to create conservation posters individually or with a partner. -Some students may want to create conservation posters using digital tools like Canva or Adobe Spark.
Kindergartners measure each other's height using large building blocks, then visit a …
Kindergartners measure each other's height using large building blocks, then visit a 2nd and a 4th grade class to measure those students. They can also measure adults in the school community. Results are displayed in age-appropriate bar graphs (paper cut-outs of miniature building blocks glued on paper to form a bar graph) comparing the different age groups. The activities that comprise this lesson help students develop the concepts and vocabulary to describe, in a non-ambiguous way, how height changes as children get older. The introduction to graphing provides an important foundation for both creating and interpreting graphs in future years.
Students will use ratios to demonstrate the connections between proportional relationships, lines, …
Students will use ratios to demonstrate the connections between proportional relationships, lines, and linear equations. Students will solve problems using a cooperative, kinesthetic activity in which they will create a ratio table, then graph proportional relationships with their bodies to demonstrate that the ratio (or rate) is the slope that will always pass through the origin.
In this three lesson series, students will analyze the effects of the …
In this three lesson series, students will analyze the effects of the drought in California. Students will analyze rainfall data and graph the annual rainfall for California. Students will understand the water cycle and explain how a drought affects the water cycle. Students will research methods to conserve water and write a persuasive argument.
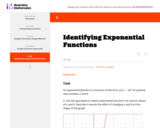
The task is an introduction to the graphing of exponential functions. The …
The task is an introduction to the graphing of exponential functions. The first part asks students to use technology to experiment with the two parameters defining an exponential function, with little guidance. Since it is important for the second part, teachers should encourage students to try a wide range of values, and in particular, values of b both less than and greater than 1. The task includes a Desmos app, in which students can make use of sliders to more viscerally see the effect of changing a and b separately.
Gait analysis is the study of human motion that can be utilized …
Gait analysis is the study of human motion that can be utilized as biometric information or identification, for medical diagnostics or for comparative biomechanics. In this activity, students observe walking human subjects and then discuss parameters that could be used to characterize walking gaits. They use accelerometers to collect and graph acceleration vs. time data that can help in gait analysisâall part of practicing the engineering data analysis process. Students complete this activity before learning the material presented in the associated lesson.
This article discusses how the study of weather can meet the NCTM …
This article discusses how the study of weather can meet the NCTM Data Analysis and Probability standard. Links to lessons for grades K-2 and 3-5 are provided.
6.0002 is the continuation of 6.0001 Introduction to Computer Science and Programming …
6.0002 is the continuation of 6.0001 Introduction to Computer Science and Programming in Python and is intended for students with little or no programming experience. It aims to provide students with an understanding of the role computation can play in solving problems and to help students, regardless of their major, feel justifiably confident of their ability to write small programs that allow them to accomplish useful goals. The class uses the Python 3.5 programming language.
This is an accelerated introduction to MATLAB® and its popular toolboxes. Lectures …
This is an accelerated introduction to MATLAB® and its popular toolboxes. Lectures are interactive, with students conducting sample MATLAB problems in real time. The course includes problem-based MATLAB assignments. Students must provide their own laptop and software. This is great preparation for classes that use MATLAB.
Students use a LEGO® ball shooter to demonstrate and analyze the motion …
Students use a LEGO® ball shooter to demonstrate and analyze the motion of a projectile through use of a line graph. This activity involves using a method of data organization and trend observation with respect to dynamic experimentation with a complex machine. Also, the topic of line data graphing is covered. The main objective is to introduce students graphs in terms of observing and demonstrating their usefulness in scientific and engineering inquiries. During the activity, students point out trends in the data and the overall relationship that can be deduced from plotting data derived from test trials with the ball shooter.
With the assistance of a few teacher demonstrations (online animation, using a …
With the assistance of a few teacher demonstrations (online animation, using a radiometer and rubbing hands), students review the concept of heat transfer through convection, conduction and radiation. Then they apply an understanding of these ideas as they use wireless temperature probes to investigate the heating capacity of different materials sand and water under heat lamps (or outside in full sunshine). The experiment models how radiant energy drives convection within the atmosphere and oceans, thus producing winds and weather conditions, while giving students the hands-on opportunity to understand the value of remote-sensing capabilities designed by engineers. Students collect and record temperature data on how fast sand and water heat and cool. Then they create multi-line graphs to display and compare their data, and discuss the need for efficient and reliable engineer-designed tools like wireless sensors in real-world applications.
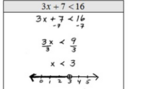
This seminar will introduce you to the concept of linear inequalities. You …
This seminar will introduce you to the concept of linear inequalities. You will learn how to solve and graph inequalities in one variable, and you will learn when and why you must consider the direction of the inequality symbol when solving the problem.StandardsCC.2.2.HS.D.10Represent, solve, and interpret equations/inequalities and systems of equations/inequalities algebraically and graphically.
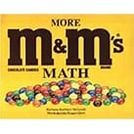
In this lesson, students will use M&M's to construct a graph, read …
In this lesson, students will use M&M's to construct a graph, read a graph, and make comparisons with other students data. The teacher will tie in literature by reading "More M&M's Math" to follow along with the lesson.
Students learn about slope, determining slope, distance vs. time graphs through a …
Students learn about slope, determining slope, distance vs. time graphs through a motion-filled activity. Working in teams with calculators and CBL motion detectors, students attempt to match the provided graphs and equations with the output from the detector displayed on their calculators.
This is a three-credit course which covers topics that enhance the students’ …
This is a three-credit course which covers topics that enhance the students’ problem solving abilities, knowledge of the basic principles of probability/statistics, and guides students to master critical thinking/logic skills, geometric principles, personal finance skills. This course requires that students apply their knowledge to real-world problems. A TI-84 or comparable calculator is required. The course has four main units: Thinking Algebraically, Thinking Logically and Geometrically, Thinking Statistically, and Making Connections. This course is paired with a course in MyOpenMath which contains the instructor materials (including answer keys) and online homework system with immediate feedback. All course materials are licensed by CC-BY-SA unless otherwise noted.
No restrictions on your remixing, redistributing, or making derivative works. Give credit to the author, as required.
Your remixing, redistributing, or making derivatives works comes with some restrictions, including how it is shared.
Your redistributing comes with some restrictions. Do not remix or make derivative works.
Most restrictive license type. Prohibits most uses, sharing, and any changes.
Copyrighted materials, available under Fair Use and the TEACH Act for US-based educators, or other custom arrangements. Go to the resource provider to see their individual restrictions.