In this unit, students are introduced to the concept of a natural …
In this unit, students are introduced to the concept of a natural cycle. They are first asked to identify the different components of the hydrologic cycle in Spanish. Students will be able to recognize the delicate balance between the individual elements of a large and complex system. Students will also be able to identify the interactions among parts of a natural system.
(Note: this resource was added to OER Commons as part of a batch upload of over 2,200 records. If you notice an issue with the quality of the metadata, please let us know by using the 'report' button and we will flag it for consideration.)
Translated and adapted by Ruth Hoff, Wittenberg University, from Unit 2 material of Environmental Justice and Freshwater Resources module by Adriana Perez, Jill S. Schneiderman, Meg Stewart, and Joshua Villalobos
Unit 2 opens a window into water accounting and reveals intensive water …
Unit 2 opens a window into water accounting and reveals intensive water use that few people think about. How much water goes into common commodities? Have you considered how much water it takes to support our modern American lifestyle and agricultural trade? Water that is embedded in products and services is called virtual water. Looking at the world through the lens of virtual water provides a watery focus to thorny discussions about water such as: the pros and cons of globalization and long distance trade; self sufficiency vs. reliance on other nations; ecosystem impacts of exports; and the impacts of relatively cheap imports on indigenous farming. Unit 2 also introduces the concept of a water footprint. A water footprint represents a calculation of the volume of water needed for the production of goods and services consumed by an individual or country. In this unit students will calculate their individual footprints and analyze how the water footprints of countries vary dramatically in terms of gross volumes and their components. As a result of these activities, students will learn of vast disparities in water access and application. They will also be challenged to consider mechanisms or policies that could foster greater equity in water footprints.
(Note: this resource was added to OER Commons as part of a batch upload of over 2,200 records. If you notice an issue with the quality of the metadata, please let us know by using the 'report' button and we will flag it for consideration.)
The basic concepts of geology will be considered to address the widely …
The basic concepts of geology will be considered to address the widely ranging textures and compositions of rocks and sediments formed in a wide range of environments. These variations in turn can affect soil formation and many related Critical Zone processes and architectures. This unit requires substantial reading to cover basic concepts of geology: the rock cycle, plate tectonics, geologic time, erosion, weathering, and deposition, so that students have a firm grasp on how geology relates to and controls CZ processes. This background knowledge is accessed through a review of web sites and a scientific papers. An in-class activity uses the U.S. Geological Survey's National Geologic Map Database to identify resources for understanding and classifying the geology of a region.
(Note: this resource was added to OER Commons as part of a batch upload of over 2,200 records. If you notice an issue with the quality of the metadata, please let us know by using the 'report' button and we will flag it for consideration.)
The example of a proposed land-use change that was used in Unit …
The example of a proposed land-use change that was used in Unit 2.3 is built upon here. The activities in this unit are meant to broaden the discussion beyond calculating quantitative run-off changes. Now we will also bring in consideration of a broader range of ecosystem services, as well as other ways in which a landscape can be valued, some of which may not be easily measured or even conceptualized as "services." Classroom time is devoted to the instructor and students exploring both (a) the stakeholders who have an interest in a particular place and (b) the various interests/uses those stakeholders may have for that place. By the end of the activity, the class should have identified several major stakeholder groups and several distinct ecosystem services. Students, organized into groups representing particular stakeholders, will then be tasked to prepare, for Unit 3.2, a group presentation, to be discussed on class on the last day of the module, that utilizes those ecosystem services as much as possible.
(Note: this resource was added to OER Commons as part of a batch upload of over 2,200 records. If you notice an issue with the quality of the metadata, please let us know by using the 'report' button and we will flag it for consideration.)
In this activity, the student groups organized at the end of Unit …
In this activity, the student groups organized at the end of Unit 3.1 will prepare presentations representing different stakeholder positions. This artifact -- Part I of the Module Summative Assessment (Microsoft Word 2007 (.docx) 25kB Sep4 16) -- can be part of a presentation to the instructor, to a panel of faculty/students, or to a "board" representing some decision-making unit (Community Council, University Board of Trustees, City/County Planning Commission). At the conclusion of this unit, students will be prompted to reflect, individually, on an ecosystem services approach to natural resources management -- Part II of the Module Summative Assessment (Microsoft Word 2007 (.docx) 23kB Sep4 16) .
(Note: this resource was added to OER Commons as part of a batch upload of over 2,200 records. If you notice an issue with the quality of the metadata, please let us know by using the 'report' button and we will flag it for consideration.)
This unit applies a flipped classroom model. Students complete a self-study tutorial …
This unit applies a flipped classroom model. Students complete a self-study tutorial prior to attending class. Students are then asked work independently or in pairs to generate a time-aware climate change Web map application using ArcGIS Online. Returning to the theme of cocoa production introduced in Unit 1, students identify climatic conditions conducive for cacao production around the world, especially West Africa where the majority of cacao is grown. Students then use a web application in ArcGIS Online to create a time aware map showing biomes in the KÃppen Climate Classification System and determine how projected climate changes will impact the suitable production regions for cacao in West Africa. Using a jigsaw model, students collect into groups of 4, with a representative from each of the IPCC scenarios, and they compare the the impact of the 4 scenarios in specified cocoa production regions. At the end of the class they will be assigned to one of three regional areas for group work in Units 4-6.
(Note: this resource was added to OER Commons as part of a batch upload of over 2,200 records. If you notice an issue with the quality of the metadata, please let us know by using the 'report' button and we will flag it for consideration.)
This unit is designed to allow students to quantitatively assess how much …
This unit is designed to allow students to quantitatively assess how much water is used for irrigating crops and how this varies across the United States. This unit also has students link water use to the economic value of the crops that are produced--spanning the scientific and economic disciplines. The concepts that students learn here will connect back to the Water Footprint concept that was introduced in Unit 2, as students consider the accuracy of water calculators.
(Note: this resource was added to OER Commons as part of a batch upload of over 2,200 records. If you notice an issue with the quality of the metadata, please let us know by using the 'report' button and we will flag it for consideration.)
Students will identify their perceptions of erosion by examining images of mountain …
Students will identify their perceptions of erosion by examining images of mountain and agricultural landscapes and discussing which environment is more erosive. They will use geospatial figures to compare erosion rates associated with both natural and agricultural landscapes in the United States. Students will then consider how the presence of agriculture has reduced the areas of soil production, replacing them with regions of soil loss. They will reflect on the negative impact of agricultural erosion on soil sustainability.
(Note: this resource was added to OER Commons as part of a batch upload of over 2,200 records. If you notice an issue with the quality of the metadata, please let us know by using the 'report' button and we will flag it for consideration.)
Students will be able to identify the functional roles that organisms play …
Students will be able to identify the functional roles that organisms play in ocean ecosystems. How do human-induced changes in ocean conditions affect biodiversity, and thereby the health and resilience of a coral reef? Students explore and discuss the direct and indirect impacts that ocean acidification can have on species, food web dynamics, ecosystem function, and commercial resources. At the end of this unit the students should be able to articulate how changes in ocean chemistry can create negative outcomes for humans who depend on living ocean resources.
(Note: this resource was added to OER Commons as part of a batch upload of over 2,200 records. If you notice an issue with the quality of the metadata, please let us know by using the 'report' button and we will flag it for consideration.)
In this unit students will explore surface water and its relationship to …
In this unit students will explore surface water and its relationship to the water cycle via watersheds and drainage divides. These topics will inform their analysis of the social and environmental impacts of the planned increase of hydroelectric dams in the Amazon. Case studies include the Ene River and the MaraÃÃn River in Peru.
(Note: this resource was added to OER Commons as part of a batch upload of over 2,200 records. If you notice an issue with the quality of the metadata, please let us know by using the 'report' button and we will flag it for consideration.)
Ruth Hoff, Wittenberg University. Authored and compiled new case study material based on Unit 3 of Environmental Justice and Freshwater Resources module by Adriana Perez, Jill S. Schneiderman, Meg Stewart, and Joshua Villalobos
Unit 3 communicates the critical need for management of fresh water and …
Unit 3 communicates the critical need for management of fresh water and ways in which citizens may take part in its conservation and restoration. Students explore the relationships between watersheds, drainage divides and the hydrologic cycle using a case study from the Hawaiian Islands involving surface water diversions from a region inhabited by indigenous people to a region comprised of large-scale agricultural fields.
(Note: this resource was added to OER Commons as part of a batch upload of over 2,200 records. If you notice an issue with the quality of the metadata, please let us know by using the 'report' button and we will flag it for consideration.)
Using a systems dynamics approach, students will work in groups to conceptualize …
Using a systems dynamics approach, students will work in groups to conceptualize and construct a model of the global carbon cycle considering five major Earth systems: atmosphere, hydrosphere, geosphere, cryosphere, and biosphere. The models will draw on information from the pre-class activity and invoke system features such as boundaries, stocks, flows, and control variables. Using a scenario describing a global, catastrophic event, the students will consider how new conditions change the behavior of carbon cycling in their model world. Students will use the model to explain changes in environmental variables such as permafrost cover, atmospheric gases, and global temperature, as well as feedbacks within the system.
(Note: this resource was added to OER Commons as part of a batch upload of over 2,200 records. If you notice an issue with the quality of the metadata, please let us know by using the 'report' button and we will flag it for consideration.)
How do slope characteristics and magnitude of forces dictate whether or not …
How do slope characteristics and magnitude of forces dictate whether or not a slope will fail? Can environmental and built characteristics change the magnitude of these forces? In this unit, students qualitatively and quantitatively consider the impact of slope angle, driving force, and frictional force on mass-wasting potential. A map activity prompts students to think about how climatic, tectonic, and geologic factors, as well as population and land use characteristics can influence mass-wasting potential.
Show more about Online Teaching suggestions Hide Online-adaptable: Part 1 (lecture) and Part 3 (discussion) are particularly straight forward to adapt to online. Part 2 student exercise is typically done with printed maps but can be successfully adapted to online by having synchronous groups of students work together to annotate digital map files using: 1) PDF annotation tools in Adobe or 2) putting the map images into a Google Slides file and using the scribble tool. Google Earth files are also provided as an additional option.
(Note: this resource was added to OER Commons as part of a batch upload of over 2,200 records. If you notice an issue with the quality of the metadata, please let us know by using the 'report' button and we will flag it for consideration.)
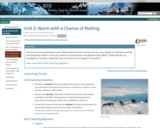
How are recent air temperature trends influencing Greenland's ice mass? Are ice …
How are recent air temperature trends influencing Greenland's ice mass? Are ice mass changes in Greenland spatially and temporally uniform? In this unit, students use atmospheric and geodetic data (GRACE, InSAR, altimetry) to investigate the location, magnitude, and causes of ice mass changes in Greenland.
Show more about Online Teaching suggestions Hide Online-adaptable:Main exercise is a jigsaw activity that can be successfully done in an online course; but it does take a bit of extra effort to arrange the students into two different sets of online groups with online collaboration. This will probably be more success in a synchronous format. OR the unit could be adapted away from the jigsaw format with Parts 2 and 3 below combined into a single exercise done individually or in static small groups.
(Note: this resource was added to OER Commons as part of a batch upload of over 2,200 records. If you notice an issue with the quality of the metadata, please let us know by using the 'report' button and we will flag it for consideration.)
The purpose of this unit is to explore, compare, contrast, and calculate …
The purpose of this unit is to explore, compare, contrast, and calculate energy fluxes from different CZO field sites to better appreciate the critical differences in the driving radiative forces affecting each site. This module will help students complete their semester-long project by introducing them to critical baseline data collection and databases related to energy budgets. The primary data set for this activity is the CZO tower network of a dozen met/flux towers spanning six different biomes/sites. Each site has a slightly different data format but it is easily manipulated in a spreadsheet. The lesson is divided into the following engaging activities:
Background lecture: Introduction to water and energy fluxes and balances Database access and graphing activity: Students will learn what data exists in the CZO database and how to load and manipulate it using Excel. Discovery activity: Students in small groups will compare monthly bar graphs of energy fluxes drawn from six Ameriflux sites and address questions concerning linkages with other variables and processes affecting energy partitioning. Reference ET Activity: Students will learn about the Penman-Monteith formulation of evaporation and calculate this from common meteorological data and compare with field measurements of evapotranspiration. The class will discuss these results as time allows.
(Note: this resource was added to OER Commons as part of a batch upload of over 2,200 records. If you notice an issue with the quality of the metadata, please let us know by using the 'report' button and we will flag it for consideration.)
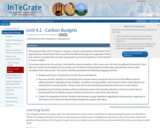
The purpose of this unit is to explore, compare, contrast, and interpret …
The purpose of this unit is to explore, compare, contrast, and interpret carbon fluxes from the Ameriflux network to better appreciate the critical factors that account for the different timing and magnitudes of fluxes among these sites. This module will help students complete their semester-long project by introducing them to critical baseline data collection and databases related to carbon budgets. The primary data set for this activity is the Amerflux network database, which spans over 150 sites throughout the Americas. Each data set is uniformly formatted and can contain up to 45 fields of meteorological and flux data collected from various eddy correlation tower instruments. The lesson is divided up between the following engaging activities:
Background lecture: Introduction to carbon fluxes and balances Discovery Activity: Students in small groups will compare various annual flux records from four different sites to address questions regarding driving variables, correlation among variables, and causative factors responsible for the overall trend in annual CO2 flux. Group results will be shared and discussed by the whole class as time allows. Database Access Activity: Students will learn what data exists in the Ameriflux data base and how to load it into an Excel spreadsheet for display using an Amerflux site that also is part of the CZO network. Carbon Flux Hypothesis Activity: Students will develop a simple hypothesis regarding the timing and/or magnitude of CO2 fluxes and use data from the Ameriflux database to support their ideas.
(Note: this resource was added to OER Commons as part of a batch upload of over 2,200 records. If you notice an issue with the quality of the metadata, please let us know by using the 'report' button and we will flag it for consideration.)
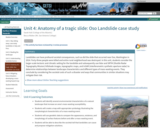
Landslides can have profound societal consequences, such as did the slide that …
Landslides can have profound societal consequences, such as did the slide that occurred near Oso, Washington in 2014. Forty-three people were killed and entire rural neighborhood was destroyed. In this unit, students consider the larger-scale tectonic and climatic setting for the landslide and subsequently use lidar and SRTM (Shuttle Radar Topography Mission) hillshade images, topographic maps, and InSAR (interferometric synthetic aperture radar) to determine relationships between landscape characteristics and different types of mass-wasting events. They conclude by considering the societal costs of such a disaster and ways that communities in similar situations may mitigate their risk.
Show more about Online Teaching suggestions Hide Online-adaptable: The exercises in unit are completely digital and thus at a logistical level it can be switched to online fairly easily. However, due to the relative complexity of the data investigations and group discussions, there will still be a fair bit of instructor support needed and/or extended small group that should be arranged.
(Note: this resource was added to OER Commons as part of a batch upload of over 2,200 records. If you notice an issue with the quality of the metadata, please let us know by using the 'report' button and we will flag it for consideration.)
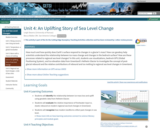
How much and how quickly does Earth's surface respond to changes in …
How much and how quickly does Earth's surface respond to changes in a glacier's mass? How can geodesy help scientists understand the relationship between ice mass change and changes in the bedrock surface? How are these processes related to regional sea level changes? In this unit, students use visualizations, bedrock GPS (Global Positioning System), and ice elevation data from Greenland's Helheim Glacier to investigate the concept of post-glacial rebound and the relative contributions of rebound and ice melting to regional sea level changes in Greenland.
Show more information on GPS versus GNSS Hide Note: Although the term GPS (Global Positioning System) is more commonly used in everyday language, it officially refers only to the USA's constellation of satellites. GNSS (Global Navigation Satellite System) is a universal term that refers to all satellite navigation systems including those from the USA (GPS), Russia (GLONASS), European Union (Galileo), China (BeiDou), and others. In this module, we use the term GPS even though, technically, some of the data may be coming from satellites in other systems.
Show more about Online Teaching suggestions Hide Online-adaptable: The lecture and main data analysis exercise can easily be moved online. The final piece is a discussion or [linkhttps://serc.carleton.edu/introgeo/gallerywalk/index.html 'gallery walk'] which can also be successfully done online but may take a little more preparation. For instance, in the case of the gallery walk, the images and questions can be available for online viewing with space available for student comments. Online groups then rotate through the stations virtually.
(Note: this resource was added to OER Commons as part of a batch upload of over 2,200 records. If you notice an issue with the quality of the metadata, please let us know by using the 'report' button and we will flag it for consideration.)
In this two-day activity spanning Units 4 and 5, students analyze spatial …
In this two-day activity spanning Units 4 and 5, students analyze spatial variation in climate through a map-based jigsaw exploration of NASA's Earth's Radiation Budget Experiment (ERBE) data. By the end of the activity, students will have created maps and graphs illustrating the global radiation balance and used their knowledge to develop and refine hypotheses regarding impacts of global climate change.
Unit 4 (day 1 of activity) begins with a brief student exploration of the global impacts of climate change and how maps can be used to effectively communicate these patterns. Students are then broken into small groups to analyze a map of one of three ERBE datasets. Students are asked to interpret geographic patterns in these data, infer the underlying causes of patterns they observe using knowledge they have accumulated in the previous units, and create an annotated map that clearly illustrates their observations and inferences. During the following class period (Unit 5), they will share their findings with a new group of classmates and work to synthesize the data to estimate the radiation balance.
(Note: this resource was added to OER Commons as part of a batch upload of over 2,200 records. If you notice an issue with the quality of the metadata, please let us know by using the 'report' button and we will flag it for consideration.)
In this unit, student groups will evaluate different environmental case studies to …
In this unit, student groups will evaluate different environmental case studies to critically investigate qualitative and quantitative data analysis, collection, and inquiry. Students will begin to consider different forms of sensory-related data collection and how experiential knowledge informs the ways in which one forms analytical, evaluative questions. Student expert groups are provided one case study (different expert groups will examine at least two different cases) that has a number of different kinds of resources that students will examine (e.g. journalistic, scientific, narrative, visual, auditory). Students will use cooperative learning methods to engage with problem-based inquiry rather than have the case study information delivered via instructor-based lecture. Given that students across disciplinary contexts may not have been exposed to scientific methods of investigation, this unit encourages systems thinking alongside other methods of investigation. As students consider the variety of perceptions that occur within a group of people sharing an environmental experience, students are able to consider the impact that different types of data have on one's perception of data collection and its analysis. This exercise also demonstrates the utility of interdisciplinary thinking -- by examining data sets from multiple academic disciplines, students gain a more complete understanding of the case study compared to what they would have understood by examining data from a single research approach. The activity also provides students with an opportunity to practice interdisciplinary thinking and collaboration skills. The cases address several key environmental challenges: soil contamination, water resources, and the impacts of industrial agriculture. A collaborative learning method is used in conjunction with guided class and group discussion to critically examine different types of data and encourage consistency of data analysis between student groups. This unit uses a group exploration and presentation activity to ensure equal distribution of materials and accountability among class participants. In essence, the students teach each other about the case studies with the instructor providing questions to elicit depth and synthesis between groups as well as to ensure that critical data analysis is undertaken.
(Note: this resource was added to OER Commons as part of a batch upload of over 2,200 records. If you notice an issue with the quality of the metadata, please let us know by using the 'report' button and we will flag it for consideration.)
No restrictions on your remixing, redistributing, or making derivative works. Give credit to the author, as required.
Your remixing, redistributing, or making derivatives works comes with some restrictions, including how it is shared.
Your redistributing comes with some restrictions. Do not remix or make derivative works.
Most restrictive license type. Prohibits most uses, sharing, and any changes.
Copyrighted materials, available under Fair Use and the TEACH Act for US-based educators, or other custom arrangements. Go to the resource provider to see their individual restrictions.