Updating search results...

Search Resources

278 Results

View
Selected filters:
  • Hydrology
  • College / Upper Division
  • Community College / Lower Division
Coastal Margins Lab
Conditional Remix & Share Permitted
CC BY-NC-SA
Rating
0.0 stars

Most students understand that water quality is an important issue, however many do not understand the complexity associated with the processes involved, the complex nature of estuarine systems, or the fact that management decisions are made based on available data sets that can be difficult at best to interpret. Students will be provided nutrient data in Excel for two Texas estuaries which they will supplement with additional information that they have compiled on these two estuaries during the duration of the course through a GIS database available to the entire class. Furthermore, students will retrieve information from the WWW to learn more about the specific estuaries and the nutrients of interest and their impacts on the environment.

(Note: this resource was added to OER Commons as part of a batch upload of over 2,200 records. If you notice an issue with the quality of the metadata, please let us know by using the 'report' button and we will flag it for consideration.)

Subject:
Biology
Hydrology
Life Science
Oceanography
Physical Science
Material Type:
Activity/Lab
Provider:
Science Education Resource Center (SERC) at Carleton College
Provider Set:
Teach the Earth
Author:
karen mcneal
Date Added:
10/21/2021
Constraints and Implications of Groundwater Temperature on the Formation of Mississippi Valley-type Zn-Pb Deposits
Conditional Remix & Share Permitted
CC BY-NC-SA
Rating
0.0 stars

This assignment is meant to illustrate how the advection of heat by groundwater leads to the elevated temperatures at shallow sedimentary basin margins at which Mississippi Valley-type Zn-Pb hydrothermal ore deposits are formed. The assignment is based on analytical solutions for groundwater flow and heat transport published by Domenico & Palciauskas (1973). Students use a spreadsheet to calculate and plot the flow field and temperature in a sedimentary basin, and to investigate the conditions needed to produce ore-forming temperatures. These results have further implications for the length of time available for ore formation and the concentration of metals and pH of the groundwater, which are also explored in the assignment. The assignment provides an example of how groundwater plays a fundamental role in an important geologic process in the Earth's crust. The activity also shows the linkages of hydrology to other disciplines such as heat transport, geochemistry, and economic geology.

(Note: this resource was added to OER Commons as part of a batch upload of over 2,200 records. If you notice an issue with the quality of the metadata, please let us know by using the 'report' button and we will flag it for consideration.)

Subject:
Biology
Chemistry
Geology
Hydrology
Life Science
Physical Science
Material Type:
Activity/Lab
Provider:
Science Education Resource Center (SERC) at Carleton College
Provider Set:
Teach the Earth
Author:
Martin Appold
Date Added:
09/12/2020
Construction of a Simple Conceptual Model
Conditional Remix & Share Permitted
CC BY-NC-SA
Rating
0.0 stars

This homework assignment is designed to give the students practice in developing a simple conceptual model using reservoirs, fluxes, and simple calculations of sediment, carbon and nutrient accumulation in a typical reservoir/river system. This assignment is typically used after an introductory lecture to biogeochemical cycles and gives the students a concrete example of nutrient and sediment issues in surface water systems.

(Note: this resource was added to OER Commons as part of a batch upload of over 2,200 records. If you notice an issue with the quality of the metadata, please let us know by using the 'report' button and we will flag it for consideration.)
Subject:
Business and Communication
Career and Technical Education
Chemistry
Environmental Studies
Hydrology
Management
Physical Science
Political Science
Social Science
Material Type:
Activity/Lab
Provider:
Science Education Resource Center (SERC) at Carleton College
Provider Set:
Teach the Earth
Author:
Scott Werts
Date Added:
05/04/2021
Copper Extraction Demonstration
Conditional Remix & Share Permitted
CC BY-NC-SA
Rating
0.0 stars

This demonstration uses sulfuric acid and crushed copper ore (malachite) to produce a solution of copper sulfate and carbonic acid in a beaker. When a freshly sanded nail is dropped into the copper sulfate solution, native copper precipitates onto the nail. The process is similar to that of heap leaching at a copper mine. The entire set-up can be placed on a wheeled cart and completed in less than 15 minutes in class. Students enjoy seeing the copper crystals form on the nail, and the experiment provides the basis for many avenues of discussion, from chemical reactions and mineral formation to problems with mine tailings and acid mine drainage.

(Note: this resource was added to OER Commons as part of a batch upload of over 2,200 records. If you notice an issue with the quality of the metadata, please let us know by using the 'report' button and we will flag it for consideration.)

Subject:
Biology
Hydrology
Life Science
Physical Science
Material Type:
Activity/Lab
Simulation
Provider:
Science Education Resource Center (SERC) at Carleton College
Provider Set:
Teach the Earth
Date Added:
09/20/2022
Creating a Water Table Map for Newark Road Prairie
Conditional Remix & Share Permitted
CC BY-NC-SA
Rating
0.0 stars

Because many students are familiar with contouring methods, they can mechanically construct water table maps from canned data sets with ease. However, their contouring abilities may mask their level of understanding. This field exercise aims to instill a deeper understanding of the nature of a water table surface as students also learn fundamental hydrogeological field techniques.

The exercise is based at Newark Road Prairie, which is owned and managed by Beloit College and located approximately five miles from campus. The property contains native prairie, wetlands, and a small stream. Although many schools may not own similar types of properties, land managers are often willing to allow the installation of shallow wells on public lands (e.g., county parks, state wildlife areas). Seven shallow monitoring wells and four staff gages are currently installed at Newark Road Prairie.

When we arrive at the field site, we begin by making observations on the subtle changes in topography and the direction of stream flow. Although we have just carried in all of the field equipment, I ask what type of information we will need to create a water table map. Handouts for the exercise are distributed after this discussion (see Supplementary Materials below).

Students are divided into groups of three for the field portion of the exercise, although each student ultimately drafts their own map using group and class data. Each group gets an electronic water level meter, a GPS unit, and a measuring tape, and we discuss the magnitude of error incorporated into the measurements taken by each of the instruments. We then review basic operation procedures for the water level meters and the GPS units, and students confirm that their GPS units are using the correct coordinate system and datum (UTM, NAD83).

We discuss surveying techniques as a class, and supplemental instructions are also provided in the handout (see Supplementary Materials below). We establish a centrally-located, bench mark (usually one of the staff gages) from which the students survey the wells and other staff gages. Each group is responsible for surveying at least two wells or staff gages. Groups distribute their surveying results to the rest of the class when we return to campus. Each group checks their results in the field, which reduces the chance of propagating surveying errors throughout the class.

Groups need to take water level measurements, survey wells, and record GPS coordinates for each well and staff gage. Additionally, because Newark Road Prairie has an established grid system with posts and markers at ten meter intervals, students measure the distance of each well/staff gage from at least three markers in order to evaluate the accuracy of their GPS measurements. Groups rotate the surveying equipment and are responsible for collecting all of the necessary data within the two lab periods. Two three-hour lab periods provide ample time for each group to collect the necessary data sets, including the time required to load/unload equipment and drive to/from the site. One 50-minute class period is provided for distributing survey results, compiling and printing base maps using ArcGIS, and contouring the water table maps.

(Note: this resource was added to OER Commons as part of a batch upload of over 2,200 records. If you notice an issue with the quality of the metadata, please let us know by using the 'report' button and we will flag it for consideration.)

Subject:
Biology
Hydrology
Life Science
Physical Science
Material Type:
Activity/Lab
Provider:
Science Education Resource Center (SERC) at Carleton College
Provider Set:
Teach the Earth
Author:
Sue Swanson
Date Added:
08/27/2019
Dam the Wilderness: Building "Green Hydropower" on Big Creek
Conditional Remix & Share Permitted
CC BY-NC-SA
Rating
0.0 stars

Student must synthesize the data that go into the construction and operation of a large hydroelectric dam. Students must strive to develop a design that minimizes or mitigates the impacts of the dam on the existing watershed. Students divide the analysis and frequently present to each other their findings. These findings are then synthesized into independent reports produced by each student.
Designed for a geomorphology course
Uses online and/or real-time data
Uses geomorphology to solve problems in other fields
Addresses student misconceptions

(Note: this resource was added to OER Commons as part of a batch upload of over 2,200 records. If you notice an issue with the quality of the metadata, please let us know by using the 'report' button and we will flag it for consideration.)

Subject:
Applied Science
Biology
Business and Communication
Environmental Science
Hydrology
Life Science
Management
Physical Science
Political Science
Social Science
Material Type:
Lesson Plan
Provider:
Science Education Resource Center (SERC) at Carleton College
Provider Set:
Teach the Earth
Author:
Ben Crosby
Date Added:
08/28/2019
Deriving Darcy's Law
Conditional Remix & Share Permitted
CC BY-NC-SA
Rating
0.0 stars

This exercise begins with a demonstration of fluid flow through porous sediment using a constant head permeameter, with the students conducting the experiment and collecting the data. The demo is followed by a Think-Pair-Share exercise in which the question is posed to the class: "What could we change in order to increase flow through the system?" The class then works through their brainstormed list of ideas, discussing each and evaluating whether it is correct or a misconception. The students derive Darcy's Law qualitatively, based upon the results of the Think-Pair-Share exercise and discussions.

(Note: this resource was added to OER Commons as part of a batch upload of over 2,200 records. If you notice an issue with the quality of the metadata, please let us know by using the 'report' button and we will flag it for consideration.)

Subject:
Biology
Hydrology
Life Science
Physical Science
Material Type:
Activity/Lab
Provider:
Science Education Resource Center (SERC) at Carleton College
Provider Set:
Teach the Earth
Author:
Karen Salvage
Date Added:
08/20/2019
Determining the 100-year floodplain of the Chippewa River
Conditional Remix & Share Permitted
CC BY-NC-SA
Rating
0.0 stars

In this activity the students calculate recurrence intervals for some historical crests on the Chippewa River and identify the 100-year flood plain in downtown Eau Claire. The students also evaluate the effect of a 20ft high stage event along the whole Chippewa River with the goal of showing how topography influences the size of the area affected by flooding events. The students also evaluate the effectiveness of a flood gate system located on campus.

(Note: this resource was added to OER Commons as part of a batch upload of over 2,200 records. If you notice an issue with the quality of the metadata, please let us know by using the 'report' button and we will flag it for consideration.)

Subject:
Biology
Hydrology
Life Science
Physical Science
Material Type:
Activity/Lab
Provider:
Science Education Resource Center (SERC) at Carleton College
Provider Set:
Teach the Earth
Author:
Bianca Pedersen
Date Added:
08/16/2019
Developing Student Ability to Ask Scientific Questions
Conditional Remix & Share Permitted
CC BY-NC-SA
Rating
0.0 stars

This activity is a two-part (three week) lab in which students initially develop a claim (non-scientific) and learn how to use evidence to support a claim. They then are provided with a scientific research question for which they need to make a claim supported with evidence from their own models (river/stream tables). Based on their results, they then ask a new research question, design the model, carry out their tests and report their results.

(Note: this resource was added to OER Commons as part of a batch upload of over 2,200 records. If you notice an issue with the quality of the metadata, please let us know by using the 'report' button and we will flag it for consideration.)
Subject:
Biology
Hydrology
Life Science
Physical Science
Material Type:
Activity/Lab
Provider:
Science Education Resource Center (SERC) at Carleton College
Provider Set:
Teach the Earth
Author:
Kaatje van der Hoeven Kraft
Date Added:
06/21/2022
Developing and Using an Index to Guide Water Supply Decisions
Read the Fine Print
Rating
0.0 stars

It's not easy to keep faucets flowing year-round in southwest Florida. To make sure their customers can get ample clean water at a good price—even through dry seasons—water utility managers crafted a useful index to help them decide which water sources to use.

Subject:
Hydrology
Physical Science
Material Type:
Case Study
Provider:
National Oceanic and Atmospheric Administration
Provider Set:
U.S. Climate Resilience Toolkit
Date Added:
08/09/2016
Did it Rain on Mars? Analysis of Valley Networks on Mars in an Intro Geo Course
Conditional Remix & Share Permitted
CC BY-NC-SA
Rating
0.0 stars

Some of the Viking images sent back from Mars in the 1970s show tantalizing evidence of dendritic valley networks in some of the oldest terrains on the planet. One of the big questions ever since has been whether it might have rained early in Mars history.

One of the ways of deciding whether the Mars valley networks might have been produced by rainfall is to find out how similar they are to valley networks on Earth, which we know are produced by rainfall. The standard method for analyzing drainage basins is comparison of the number of drainage segments per square kilometer (drainage density) and how extensively branched the network is (stream order).

In this exercise, students calculate stream order for valley segments mapped by Hynek and Phillips (2003) using MOC/MOLA data. Students then use data on valley segment length and drainage basin area from Hynek and Phillips (2003) to calculate drainage density. They compare stream order and drainage density for the Mars site with similar calculations for areas on Earth and evaluate the question of whether valley networks on Mars might be consistent with rainfall on an early Mars, and what the uncertainties and limitations are in their conclusions.

(Note: this resource was added to OER Commons as part of a batch upload of over 2,200 records. If you notice an issue with the quality of the metadata, please let us know by using the 'report' button and we will flag it for consideration.)

Subject:
Applied Science
Biology
Environmental Science
Hydrology
Life Science
Physical Geography
Physical Science
Material Type:
Activity/Lab
Provider:
Science Education Resource Center (SERC) at Carleton College
Provider Set:
Teach the Earth
Author:
Barb Tewksbury
Date Added:
12/11/2020
Discharge and Sediment Transport in the Field
Conditional Remix & Share Permitted
CC BY-NC-SA
Rating
0.0 stars

In this quantitative field activity, students collect field data on channel geometry, flow velocity, and bed materials. Using these data, they apply flow resistance equations and sediment transport relations to estimate the bankfull discharge and to determine if the flow is sufficient to mobilize the bed.

(Note: this resource was added to OER Commons as part of a batch upload of over 2,200 records. If you notice an issue with the quality of the metadata, please let us know by using the 'report' button and we will flag it for consideration.)

Subject:
Biology
Geoscience
Hydrology
Life Science
Mathematics
Measurement and Data
Physical Science
Statistics and Probability
Material Type:
Activity/Lab
Provider:
Science Education Resource Center (SERC) at Carleton College
Provider Set:
Teach the Earth
Author:
Jeff Clark
Date Added:
08/23/2019
Discussion worksheets for popular literature readings on river processes and policy
Conditional Remix & Share Permitted
CC BY-NC-SA
Rating
0.0 stars

I find that when assigning lengthy readings for in-class discussion, it is extremely helpful to guide students' preparation with specific questions, and incorporate these in worksheets that explicitly call for students to write out their responses before entering the classroom. These worksheets can provide some added structure for whole-class discussion, or can provide a specific agenda for review of the readings in small groups. Because these readings are more than a few years old, I have also found it useful to assign small groups of students to give brief reports that expand on and update the issues raised in the readings.

(Note: this resource was added to OER Commons as part of a batch upload of over 2,200 records. If you notice an issue with the quality of the metadata, please let us know by using the 'report' button and we will flag it for consideration.)

Subject:
Biology
Business and Communication
Career and Technical Education
Economics
Environmental Studies
Hydrology
Life Science
Management
Physical Science
Political Science
Social Science
Material Type:
Activity/Lab
Simulation
Provider:
Science Education Resource Center (SERC) at Carleton College
Provider Set:
Teach the Earth
Author:
Scott Rice-Snow
Date Added:
11/18/2021
Dynamic Reservoir - In-class activity
Conditional Remix & Share Permitted
CC BY-NC-SA
Rating
0.0 stars

This is an in-class activity analyzing our drinking water reservoir, but would apply to any reservoir for which there are basic crest/elevation data and maps available.

(Note: this resource was added to OER Commons as part of a batch upload of over 2,200 records. If you notice an issue with the quality of the metadata, please let us know by using the 'report' button and we will flag it for consideration.)

Subject:
Biology
Business and Communication
Career and Technical Education
Environmental Studies
Hydrology
Life Science
Management
Physical Science
Political Science
Social Science
Material Type:
Activity/Lab
Provider:
Science Education Resource Center (SERC) at Carleton College
Provider Set:
Teach the Earth
Author:
Cynthia Fadem
Date Added:
08/06/2019
Earth Exploration Toolbook Chapter: Exploring Characteristics of Wetlands
Conditional Remix & Share Permitted
CC BY-NC-SA
Rating
0.0 stars

DATA: Worldwide Wetlands Inventory. TOOL: Ramsar International Wetlands Data Gateway. SUMMARY: Learn about wetlands around the world. Perform a series of searches to identify wetland areas that need protection.

(Note: this resource was added to OER Commons as part of a batch upload of over 2,200 records. If you notice an issue with the quality of the metadata, please let us know by using the 'report' button and we will flag it for consideration.)
Subject:
Biology
Business and Communication
Hydrology
Life Science
Management
Physical Science
Political Science
Social Science
Material Type:
Activity/Lab
Data Set
Lesson Plan
Provider:
Science Education Resource Center (SERC) at Carleton College
Provider Set:
Teach the Earth
Author:
Robert Downs
Date Added:
12/11/2020
Earth Exploration Toolbook Chapter: Measuring Distance and Area in Satellite Images
Conditional Remix & Share Permitted
CC BY-NC-SA
Rating
0.0 stars

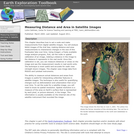
DATA: MODIS Imagery. TOOL: ImageJ. SUMMARY: Examine images of the Aral Sea from 1973 through 2003. Use image analysis software to measure changes in the width and area of the freshwater lake over time.

(Note: this resource was added to OER Commons as part of a batch upload of over 2,200 records. If you notice an issue with the quality of the metadata, please let us know by using the 'report' button and we will flag it for consideration.)
Subject:
Applied Science
Biology
Chemistry
Geoscience
History
History, Law, Politics
Hydrology
Life Science
Physical Science
Space Science
Technology
Material Type:
Activity/Lab
Data Set
Diagram/Illustration
Interactive
Lesson Plan
Provider:
Science Education Resource Center (SERC) at Carleton College
Provider Set:
Teach the Earth
Author:
LuAnn Dahlman
Date Added:
12/03/2019
Earth Exploration Toolbook Chapter: Water Availability
Conditional Remix & Share Permitted
CC BY-NC-SA
Rating
0.0 stars

DATA: North American Regional Reanalysis (NARR). TOOL: FieldScope GIS. SUMMARY: Use an online GIS from the National Geographic Society, to investigate the relationship between precipitation, evaporation, and surface runoff.

(Note: this resource was added to OER Commons as part of a batch upload of over 2,200 records. If you notice an issue with the quality of the metadata, please let us know by using the 'report' button and we will flag it for consideration.)
Subject:
Biology
Hydrology
Life Science
Physical Science
Material Type:
Activity/Lab
Diagram/Illustration
Interactive
Provider:
Science Education Resource Center (SERC) at Carleton College
Provider Set:
Teach the Earth
Date Added:
07/10/2020
Earth Exploration Toolbook Chapter: When is Dinner Served? Predicting the Spring Phytoplankton Bloom in the Gulf of Maine
Conditional Remix & Share Permitted
CC BY-NC-SA
Rating
0.0 stars

DATA: Ocean Buoy Data, MODIS Images TOOLS: GoMOOS Online Graphing Tool SUMMARY: Learn about conditions that influence the spring phytoplankton bloom. Use an online graphing tool to predict the date of the bloom.

(Note: this resource was added to OER Commons as part of a batch upload of over 2,200 records. If you notice an issue with the quality of the metadata, please let us know by using the 'report' button and we will flag it for consideration.)
Subject:
Biology
Chemistry
Geoscience
Hydrology
Life Science
Physical Science
Material Type:
Activity/Lab
Data Set
Diagram/Illustration
Interactive
Lesson Plan
Provider:
Science Education Resource Center (SERC) at Carleton College
Provider Set:
Teach the Earth
Author:
Amy Holt Cline
Denise Blaha
Date Added:
12/11/2020
Earth Surface Processes in the Critical Zone
Conditional Remix & Share Permitted
CC BY-NC-SA
Rating
0.0 stars

Rapid changes at Earth's surface, largely in response to human activity, have led to the realization that fundamental questions remain to be answered regarding the natural functioning of the Critical Zone, the thin veneer at Earth's surface where the atmosphere, lithosphere, hydrosphere and biosphere interact. EARTH 530 will introduce you to the basics necessary for understanding Earth surface processes in the Critical Zone through an integration of various scientific disciplines. Those who successfully complete EARTH 530 will be able to apply their knowledge of fundamental concepts of Earth surface processes to understanding outstanding fundamental questions in Critical Zone science and how their lives are intimately linked to Critical Zone health.

Subject:
Applied Science
Atmospheric Science
Chemistry
Environmental Science
Geology
Hydrology
Physical Science
Material Type:
Full Course
Provider:
Penn State College of Earth and Mineral Sciences
Author:
Tim White
Date Added:
10/07/2019
Earth in the Future
Conditional Remix & Share Permitted
CC BY-NC-SA
Rating
0.0 stars

Our planet is becoming hot. In fact, Earth may be warming faster than ever before. This warming will challenge society throughout the 21st century. How do we cope with rising seas? How will we prepare for more intense hurricanes? How will we adapt to debilitating droughts and heat waves? Scientists are striving to improve predictions of how the environment will change and how it will impact humans. Earth in the Future: Predicting Climate Change and Its Impacts Over the Next Century is designed to provide the state of the art of climate science, the impact of warming on humans, as well as ways we can adapt. Every student will understand the challenges and opportunities of living in the 21st century.

Subject:
Applied Science
Atmospheric Science
Biology
Environmental Science
Geology
Hydrology
Life Science
Oceanography
Physical Science
Material Type:
Full Course
Provider:
Penn State College of Earth and Mineral Sciences
Author:
David Bice
Tim Bralower
Date Added:
10/07/2019